Track Your Usage
min read - Updated on Nov 04, 2026The Usage page shows how much of your Kimola package your team has used in a billing period. It lists every time queries were spent, with the number of queries, the model they were spent on and the date, adds them up by type, and compares your queries, custom AI models, keywords and links with what your package includes. You can also download the usage of a billing period as a PDF file.
You need to be signed in to Kimola. You start from Usage under Account in the left menu.
Choose a Billing Period
Kimola counts usage per billing period. A billing period lasts one month and starts on the same day every month, for example Jan 05, 2026 - Feb 05, 2026. The page opens on the current period.
To see another period, open Billing Periods at the top right of the page and choose one. The list holds every billing period since your account started, newest first. The chart, the list of queries and the Types card change to the period you choose.
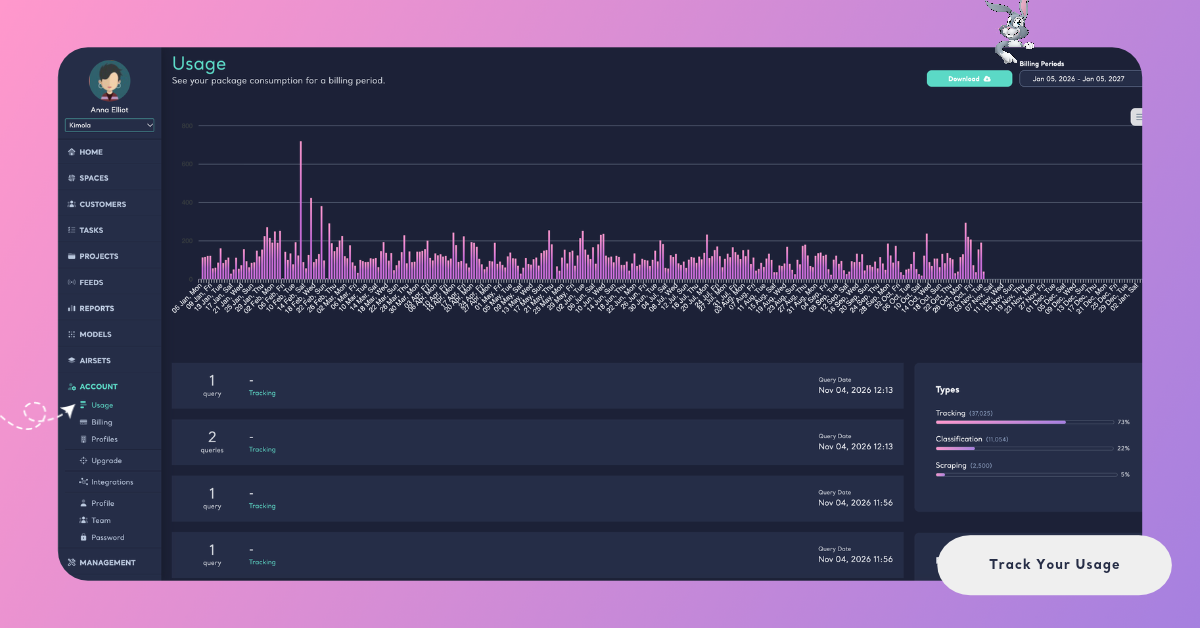
The chart under the page title shows how many queries were spent on each day of the period, one bar per day. The menu at the top right of the chart offers Download SVG and Download PNG to save the chart as an image, and Download CSV to save its daily numbers as a spreadsheet file.
When nothing was spent in the period you chose, the page says No queries found in this billing period.
Queries
Below the chart, the page lists every time queries were spent in the period, newest first. Each entry shows the number of queries, the model they were spent on, the type of the spend and its Query Date. Entries without a model show a dash in place of the model's name. More entries load as you scroll down.
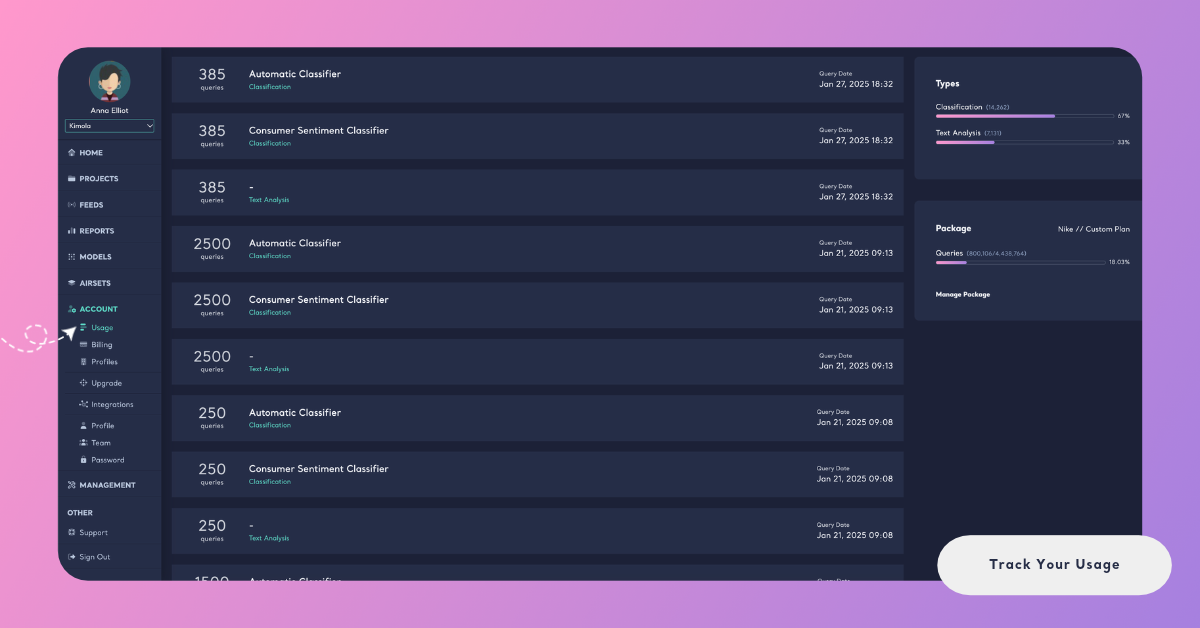
The type of an entry tells you what the queries were spent on:
- Classification: feedback classified with a model, for example when you create a Report. The entry names the model, such as Automatic Classifier.
- Scraping: reviews collected from the web pages you add as links.
- Tracking: mentions and reviews your Feeds collect.
When the same rows are classified with several models, every model gets an entry of its own. This follows the query rule: queries = rows × models × Dimensions. One analyzed row costs one query for every model and every Dimension it is analyzed with. How to Calculate Queries? explains the rule for Reports, Feeds and Spaces.
An online course platform creates a Report from 2,000 course reviews with the Automatic Classifier and the Sentiment Classifier, without Dimensions. The list shows two Classification entries of 2,000 queries each, one for each model, and 4,000 queries in all.
The Types card on the right adds up the period's queries by type. It shows each type with its number of queries and its share of the period's total.
The Package card under it names your package. Its Queries line shows how many queries have been used out of the queries your package includes for the billing period, with a bar and a percentage.
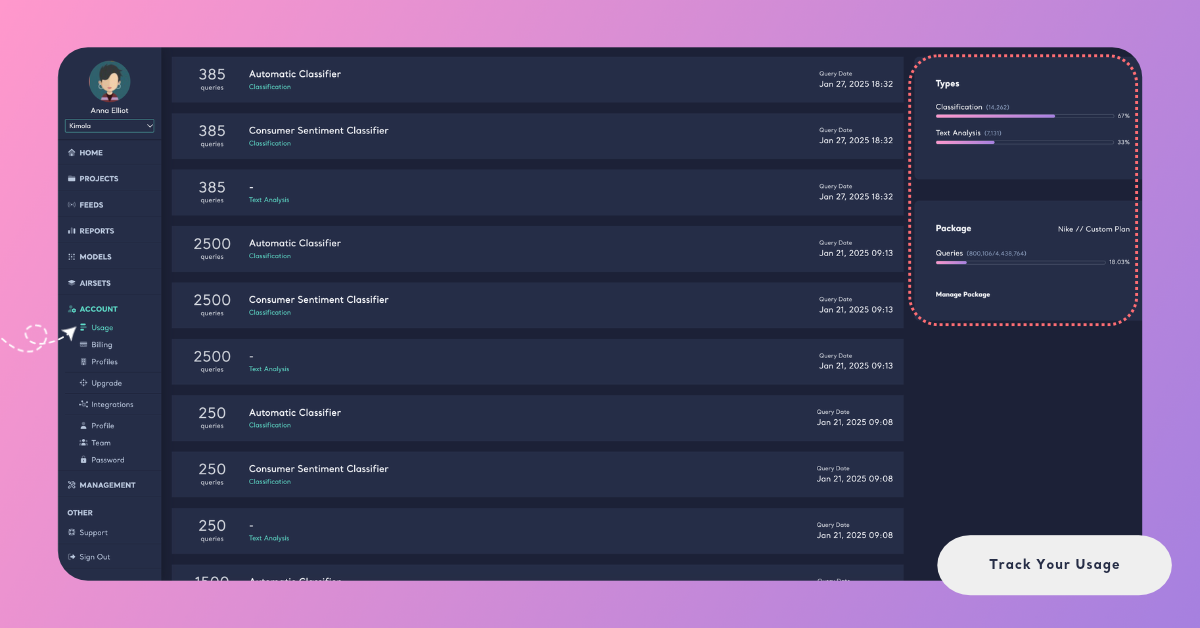
What each package includes changes over time, so this article gives no numbers. See kimola.com/pricing for the current packages.
Keywords, Links and Custom Models
The Package card also shows Custom AI Models, Keywords and Links. Each line shows how many you have now out of the most your package allows at the same time, with a bar and a percentage.
- Custom AI Models: the custom models stored in your account.
- Keywords: the keywords your Feeds track mentions for across the web.
- Links: the web addresses your Feeds monitor for new reviews.
These three count what your account holds at a time, not what it spent in a period. They stay the same whichever billing period you choose, and they don't start again from zero with a new period.
When you reach one of these limits, Kimola tells you and offers See Packages and Upgrade. Manage Package at the bottom of the card opens the Upgrade page, where you can compare the packages and move to another one. See Upgrade Your Plan.
The Starter package doesn't include Feeds or custom AI models.
Download Your Query Log
You can keep a record of a billing period's usage, for example to share it with your finance team or to compare months.
Choose the period in Billing Periods first, then click Download at the top of the page. Kimola prepares the usage of that billing period as a PDF file, and your browser saves it.
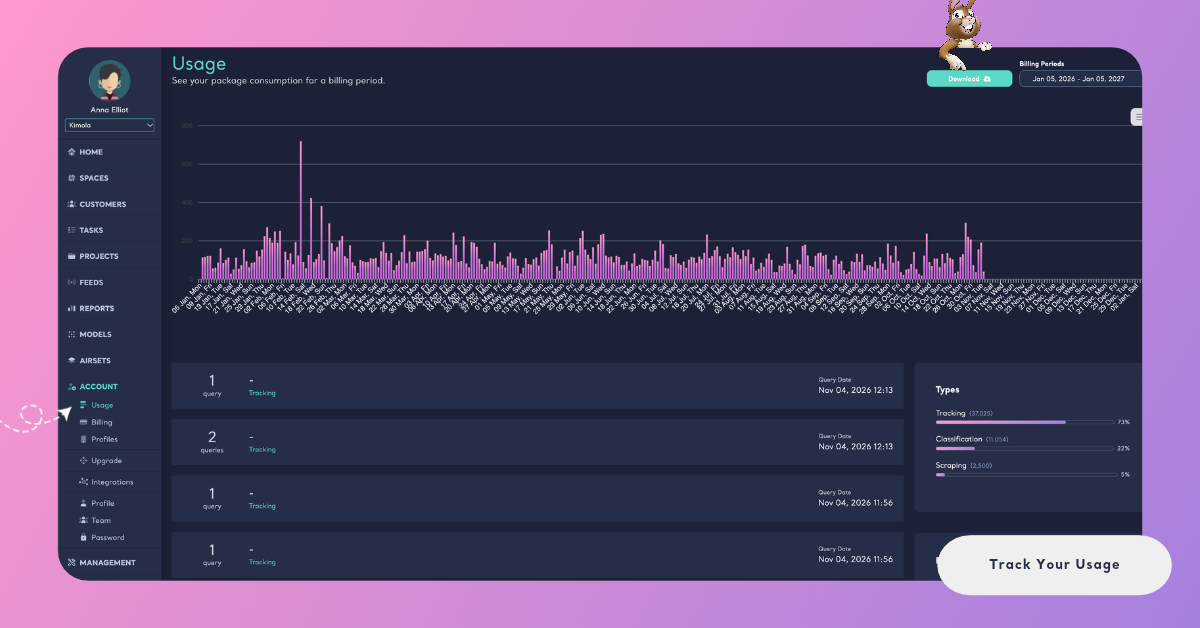
To work with the daily numbers in a spreadsheet, use Download CSV in the chart's menu.