What is the Substitutions Dimension?
min read - Updated on Nov 02, 2026Substitutions is the Dimension that asks every piece of customer feedback "Instead of what does this occur?" It shows which alternatives the described experience replaces or is compared against: a rival product, an earlier version, another brand in the same category, a different way of solving the same problem, or doing it by hand. Kimola groups the same alternative across all of your reviews, survey responses and support conversations and counts the records behind each one, so you see what your customers compare you to and how much of your feedback each alternative accounts for. Substitutions belongs to the Comparisons group and is available in every package.
A Dimension is a research question Kimola asks of every piece of feedback. Themes tell you what customers talk about, and sentiment tells you how they feel about it. Substitutions tells you what your product stands in for in your customers' minds, so you learn who you win customers from, who you lose them to and which habits you compete with. Every answer stays tied to the feedback that gives it, so you can open the records behind an alternative and read them.
To use Substitutions, you need a Kimola account and customer feedback to analyze. If you don’t have an account yet, sign up first.
For a Report, sign in and open the report you want to work with from the Reports section. If you haven’t created a report yet, follow one of these guides: Create a Report by Uploading a Custom Dataset, Create a Report by Adding Links
You can select Substitutions while creating the Report or add it later. For instructions, see Use It in Kimola.
For a Space, you need a Funnel with a Substitutions Dimension model. If you haven’t set these up yet, see Create a Funnel, Add Dimensions to a Funnel and Create a Space. Upload feedback to the Space after adding the model so it can be classified with Substitutions.
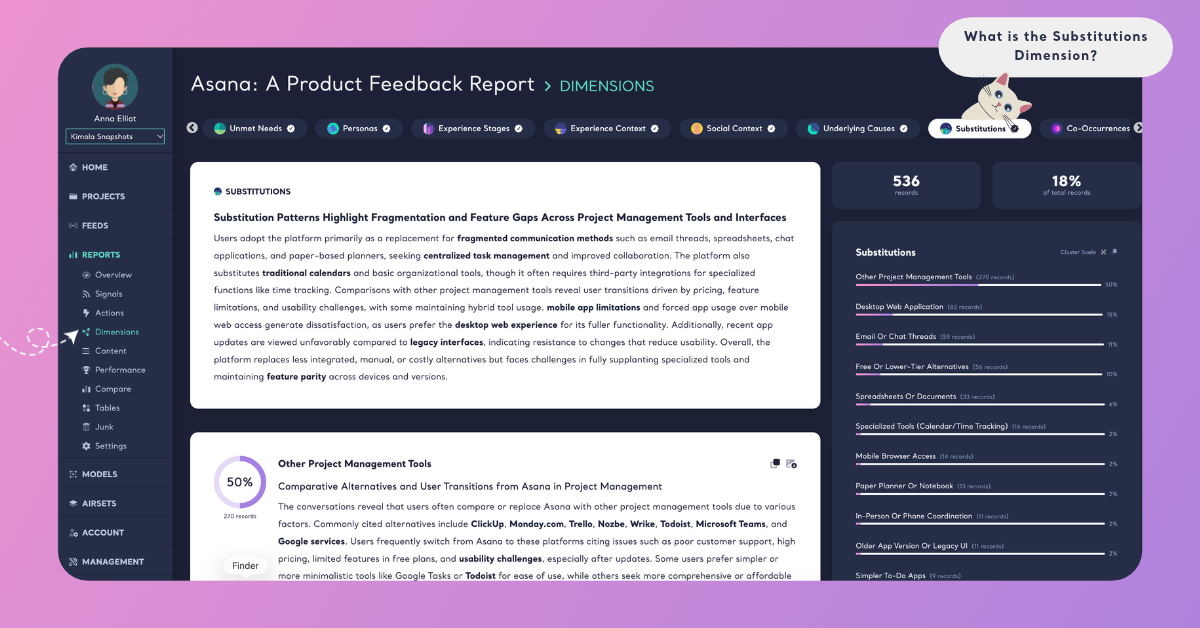
The Question It Asks
Substitutions asks one question of each record: "Instead of what does this occur?" The answer is the alternative the customer sets your product or service against, taken from what the feedback says. It works in two directions. Some feedback describes a replacement: "I switched from…", "I used to do this in a spreadsheet", "We dropped our old supplier". Other feedback describes a comparison: "cheaper than…", "not as fast as the previous version", "I almost bought the other model instead". Both name an alternative, and both are answers for Substitutions.
The alternative is not always a competitor. Customers often compare a product with a habit or a workaround: pen and paper, a phone call, a visit to a branch, cooking at home instead of ordering, or doing nothing at all. These answers matter as much as brand names, because they show the real alternatives your product competes with. Feedback that names no alternative gets no answer for Substitutions. That is expected: a review such as "Easy to set up and the battery lasts all day." compares the product with nothing. The share of records that answer Substitutions tells you how much of your feedback is comparative at all. One piece of feedback can name more than one alternative, and each one is counted.
Substitutions is different from Co-Occurrences, the other Dimension of the Comparisons group. Co-Occurrences asks "Alongside what does this occur?" and finds the products, tools and behaviors used together with the experience; Substitutions finds the ones it replaces or competes with. A printer a customer uses with your laptop is a co-occurrence; the laptop they had before is a substitution. It is also different from Motivations, which asks "Why is this chosen or preferred?" Substitutions names what customers chose you over, and Motivations gives the reasons.
What You Get
Kimola builds the answers of Substitutions from your data. It reads the dataset, finds the alternatives the feedback names or describes and names each answer in their terms, so the alternatives behind a food delivery app and those behind an accounting tool come out different. Across thousands of records, Kimola groups the same alternative under one answer and counts the records that give it. The counts and shares come from the classification itself; an AI model writes the summaries afterwards, from numbers that are already computed.
In a Report
On the Report's Dimensions page, Substitutions has its own tab. A ring shows the share of the Report's records that answer the question. The summary card gives a headline and a few paragraphs on what your customers compare you with and which alternatives they leave for you, with key terms in bold. Below it, each alternative is a cluster with its number of records, its share, a short summary. An alternative with very few records gets no summary, and the page says "Summaries are not available due to small cluster sizes."
Cluster Scale shows each alternative's share of the records that answer Substitutions, and Dataset Scale shows its share of all the records in the Report. Because one record can name several alternatives, the shares on Cluster Scale can add up to more than 100%. The Columns and Dimensions buttons on a cluster card show what lies behind an alternative, for example the Pain Points of customers who compare you with a rival, or the countries the comparisons with a local brand come from. See Dimensions in Reports.
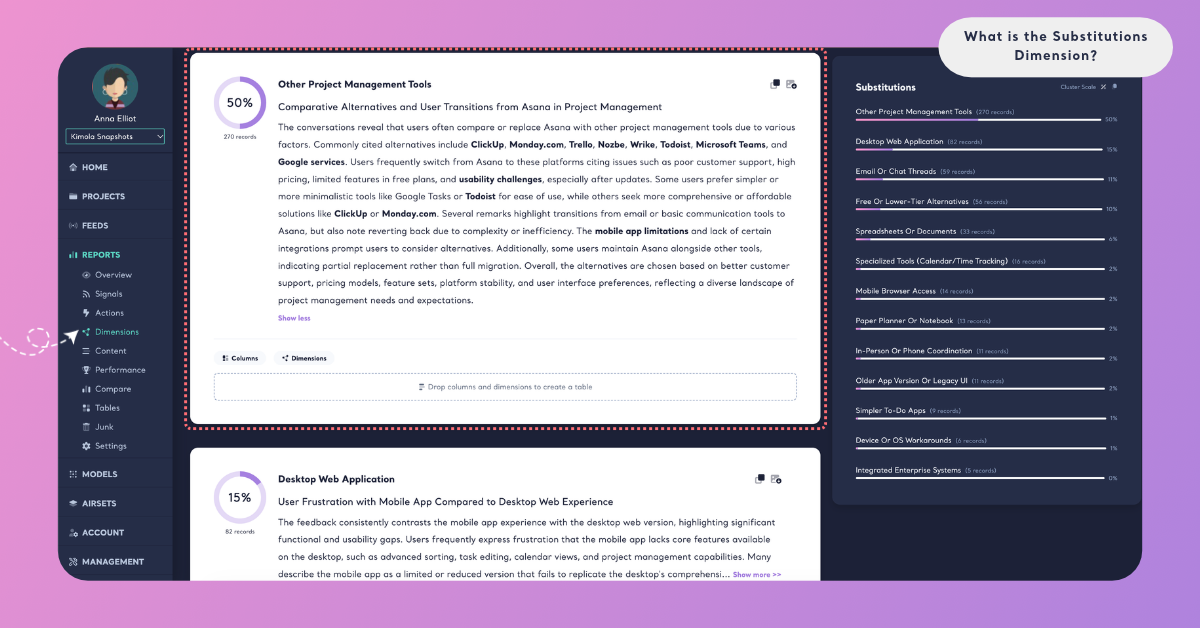
In a Space
Spaces are available in the Enterprise package. On a Space's Dimensions page, Substitutions shows its answers under What they talk about and how they change Over time. An alternative whose share changed significantly with the last upload is marked ▲ or ▼ "since the last upload", which can show a new rival starting to appear in your feedback. Kimola writes Insights after every new file: What the answers say for Substitutions as a whole, and Why they answer so for each alternative that at least 10 of the latest records give. In a Space, the answers come from the labels of the Funnel's Substitutions model. See Dimensions in Spaces.
In both Reports and Spaces, you can filter the Content and Performance pages by an alternative, or cross Substitutions with a column or a classifier in Tables, for example Substitutions by sentiment or by country.
An Example
Take this invented review of a household budgeting app:
"Before this, I kept our budget in a spreadsheet, and for a few months I tried the free app my bank offers, but it couldn't split shared expenses. This one does that well. It's pricier than the bank's app, though, and I still keep a paper envelope for cash."
Substitutions finds two answers in it. "Spreadsheets" comes from the budget the customer kept before, an alternative the app replaced. "The bank's own app" comes from the free app the customer tried and still compares the price with. Substitutions needs no purchase history or survey question about competitors for this: the alternatives come from the text. The paper envelope for cash is not a substitution, because the customer keeps it next to the app; it is an answer for Co-Occurrences. Splitting shared expenses, the reason the customer switched, is picked up by Motivations, and the higher price by Pain Points, when those Dimensions are added.
A second review, "Clean design, and the monthly summary is easy to read.", compares the app with nothing, so it gets no Substitutions answer.
Across a dataset of 5,000 reviews, the same alternatives gather into clusters. "Spreadsheets" might be the largest, with 940 records, followed by "Banking apps" and "Pen and paper". The summary would then say that most customers come from doing their budget by hand rather than from another app, and crossing Substitutions with Motivations in Tables would show that customers who left spreadsheets chose the app for automatic bank sync while those who left banking apps chose it for shared budgets.
The answer names and numbers here are illustrative: Kimola names the alternatives of your own data in your customers' words.
When to Use It
Use Substitutions whenever a decision depends on what your product competes with. It reads best in feedback where customers compare and choose: product and app store reviews, software review sites, open-ended survey answers, cancellation and churn surveys, and support conversations where customers mention another provider.
Competitive landscape. See which alternatives your customers name most and how often each one comes up. The list often holds more than your known competitors: an older product of yours, a cheaper category or a manual habit can be what you actually compete with.
Switching in and out. Cross Substitutions with Motivations to see why customers leave an alternative for you, and with Pain Points to see what pushes them toward an alternative. Feedback from a cancellation survey that names a rival tells you who you lose customers to and why.
Positioning and messaging. The largest alternatives tell you what to position against. Customers who come from spreadsheets need a different message than customers who come from a rival app, and the quotations give you the comparisons in their own words.
Pricing and value. Cross Substitutions with sentiment in Tables to see which comparisons are favorable and which are not. Comparisons on price and on quality often point in different directions.
Competitors. Create a Report from the review pages of a rival's product to see what their customers compare them with. You may find your own product among their answers, with the reasons customers prefer one over the other.
Change over time. In a Space, follow whether an alternative starts to collect more feedback, for example after a rival's launch or a price change of your own.
Substitutions works best together with Co-Occurrences, the other Dimension of the Comparisons group: Co-Occurrences ("Alongside what does this occur?") shows what customers use with your product, and Substitutions shows what they use instead of it. Together they show where your product sits among the tools and habits around it. Outside its group, Motivations and Underlying Causes give the reasons behind a switch, Pain Points and Unmet Needs show what drives customers to an alternative, and Personas shows who makes each comparison.
Use It in Kimola
How you add Substitutions depends on whether you work in a Report or a Space.
In a Report
Select Substitutions in the Dimensions step while you create a Report. It is listed under All and under Comparisons. Click it to add it to My List, then check the Required Query in the Review step. To add it to a Report that is already analyzed, open the Report's Dimensions page, click the Substitutions tab without a check mark and click Generate Now. Kimola classifies the Report's existing records with Substitutions and writes its analysis. The steps are in Add Dimensions to a Report.
Dimensions add to the queries a Report uses: queries = rows × models × Dimensions. For what your package includes, see kimola.com/pricing.
In a Space
A Space gets Substitutions from a Dimension model in its Funnel. In Models, click Create AI Model, choose By Prompt, click Dimension in the Purpose step and choose Substitutions under Which dimension?. Its Question and Description are filled in, and you can fine-tune them for your business. In Labels, define the alternatives your Spaces can find, such as "A rival app", "Spreadsheets", "An earlier version" or "Doing it by hand", each with a short description. Then pick the model on the DIMENSIONS tab of the Funnel wizard's Models step. Every file uploaded to the Funnel's Spaces after that is classified with Substitutions. The steps are in Add Dimensions to a Funnel.
Spaces are available in the Enterprise package. They are also available in Kimola On-Premises.