Dimensions in Spaces
min read - Updated on Oct 30, 2026Dimensions is the page of a Space that shows how its feedback answers each research question of its Funnel, such as Pain Points ("What goes wrong or creates difficulty?") or Personas ("Who is experiencing this?"). For every Dimension, the page lists the answers customers give with their share, marks the answers that changed significantly with the last upload, and shows the Insights Kimola writes about them after every new file: What the answers say for the Dimension and Why they answer so for each answer. Click an answer to see why customers give it, which themes they talk about when they give it, how its share moved over time, and the feedback behind it.
To explore Dimensions in a Space, you need a Kimola account and a Space connected to a Funnel with Dimension models. If you don’t have an account yet, sign up first.
If you haven’t created a Funnel yet, see Create a Funnel. To include Dimensions in your Funnel, see Add Dimensions to a Funnel. If you haven’t created a Space yet, follow the steps in Create a Space.
Sign in to your Kimola account and open the Space you want to work with from the Spaces section. Make sure the Space has classified feedback so you can explore its answers and the records behind them.
You open the page with Dimensions in the menu of an open Space. Dimension Details and All Dimensions on the Space's Overview open it too, and an answer listed under With the latest files on Overview opens here with that answer selected.
Spaces are available in the Enterprise package. They are also available in Kimola On-Premises.
What You See
The page starts with the name of the Space and a line that tells what it holds, for example "500 records covering November 4th 2024 to March 1st 2025, with the date and time of the last upload. When the Space classifies more than one text field, such as what customers liked and what they would improve in a survey, a switch next to the title lets you read the Dimensions through one text field or all of them.
Below the title, the page is read from top to bottom in this order.
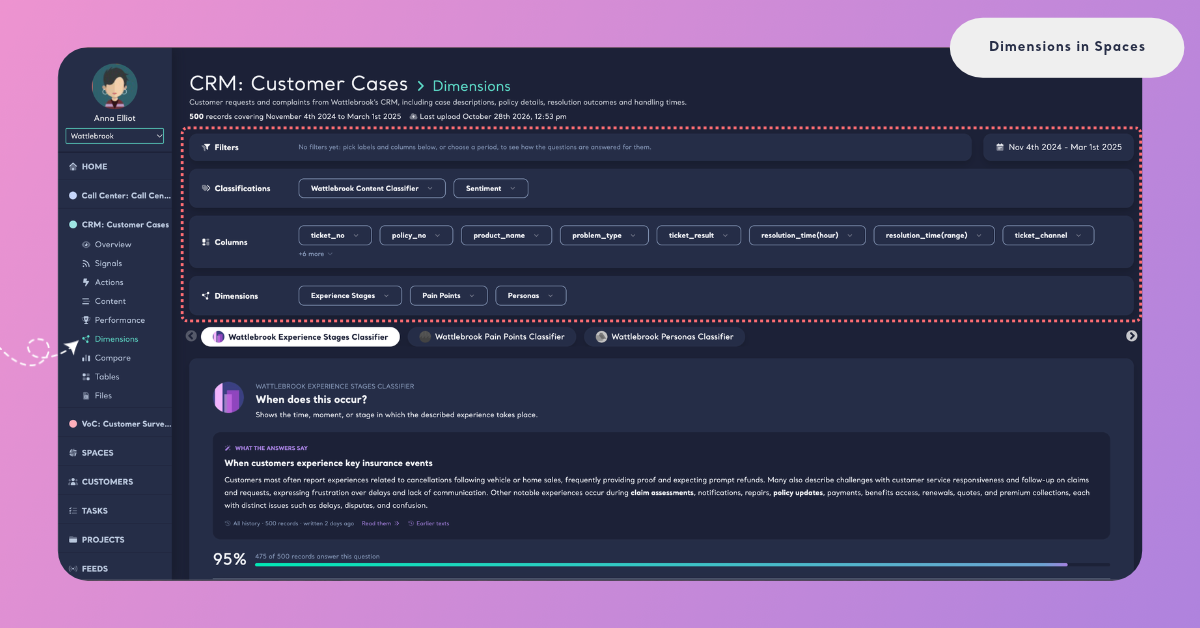
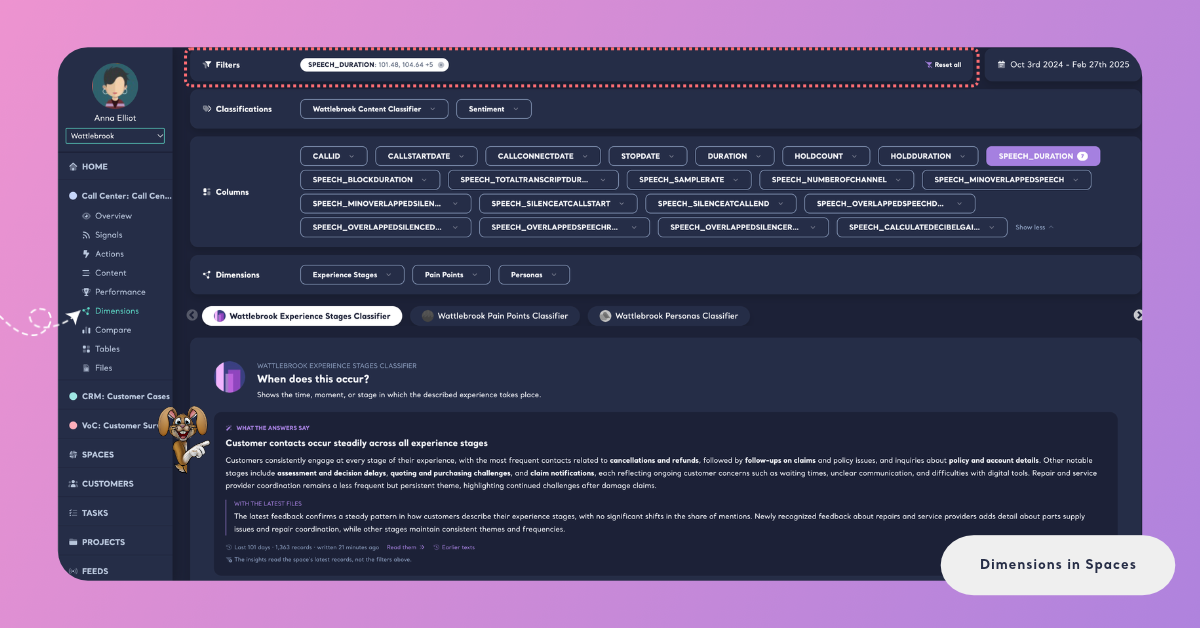
Filters. The Filters card with the period of the page, and the Classifications, Columns and Dimensions cards you pick filters from. Without filters, the card says "No filters yet: pick labels and columns below, or choose a period, to see how the questions are answered for them."
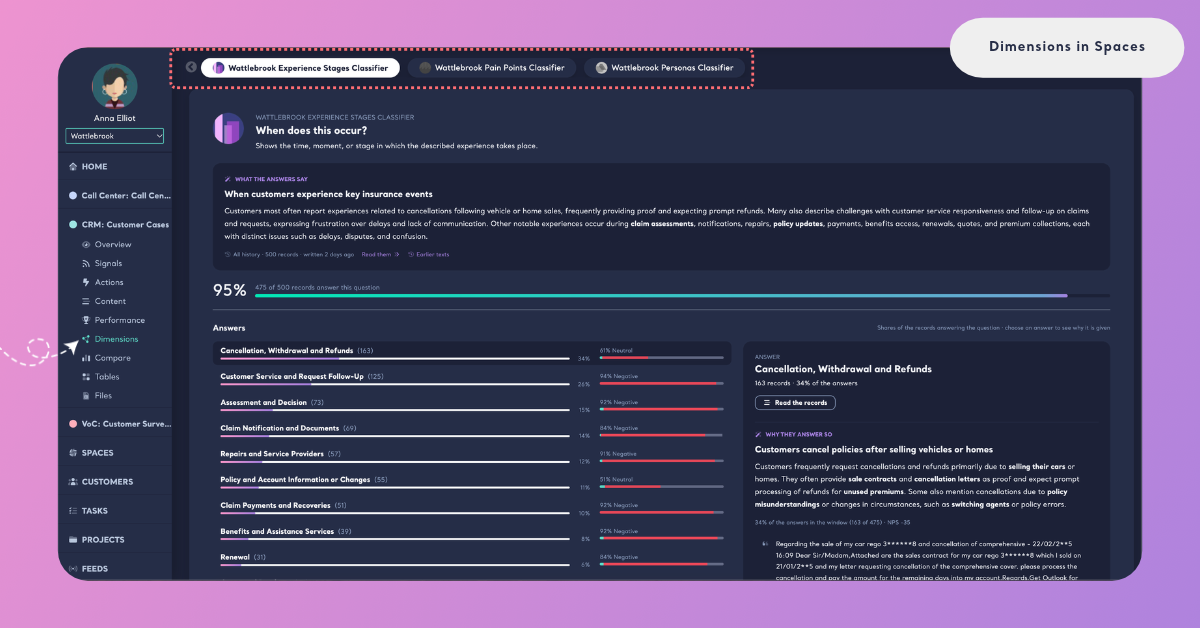
The Dimension tabs. One tab for every Dimension of the Funnel, in a row you move through with the arrows on its sides. Hover over a tab to read the Dimension's question, and click it to open the Dimension. The first Dimension is open when the page loads.
The Dimension. Its name, its question in large type and its description, as written in its Dimension model.
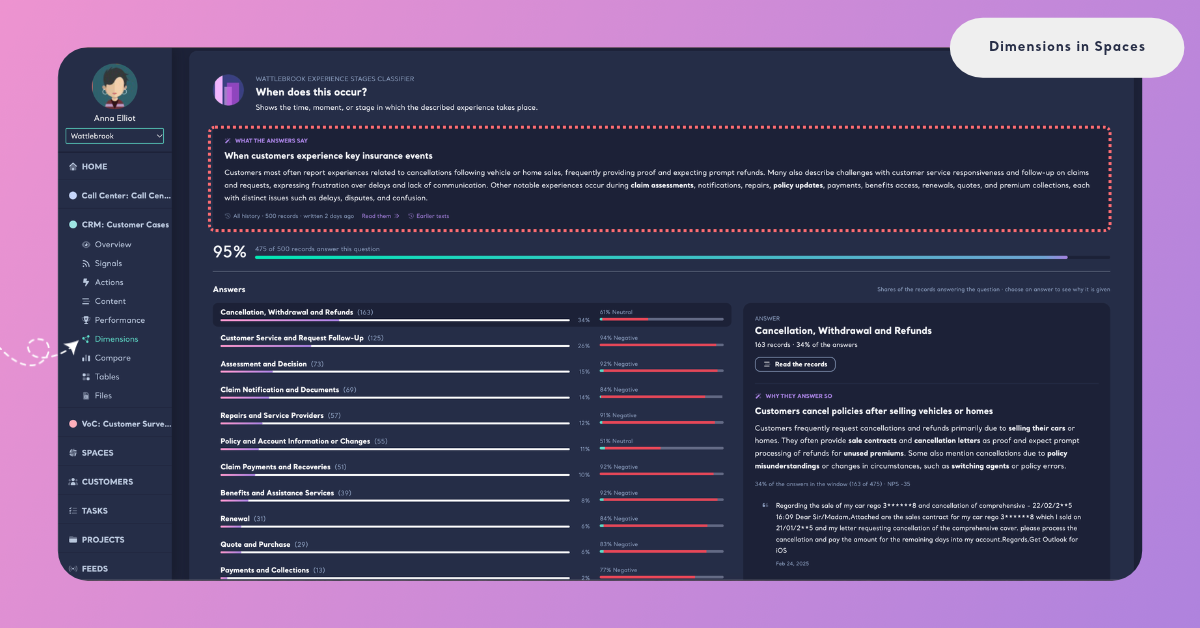
What the answers say. The Dimension's Insight, written over its answers.
How many records answer it. A large percentage with a bar and a line such as "475 of 500 records answer this question". Feedback that says nothing about the question gets no answer, so this share tells you how often customers talk about the subject of the Dimension at all.
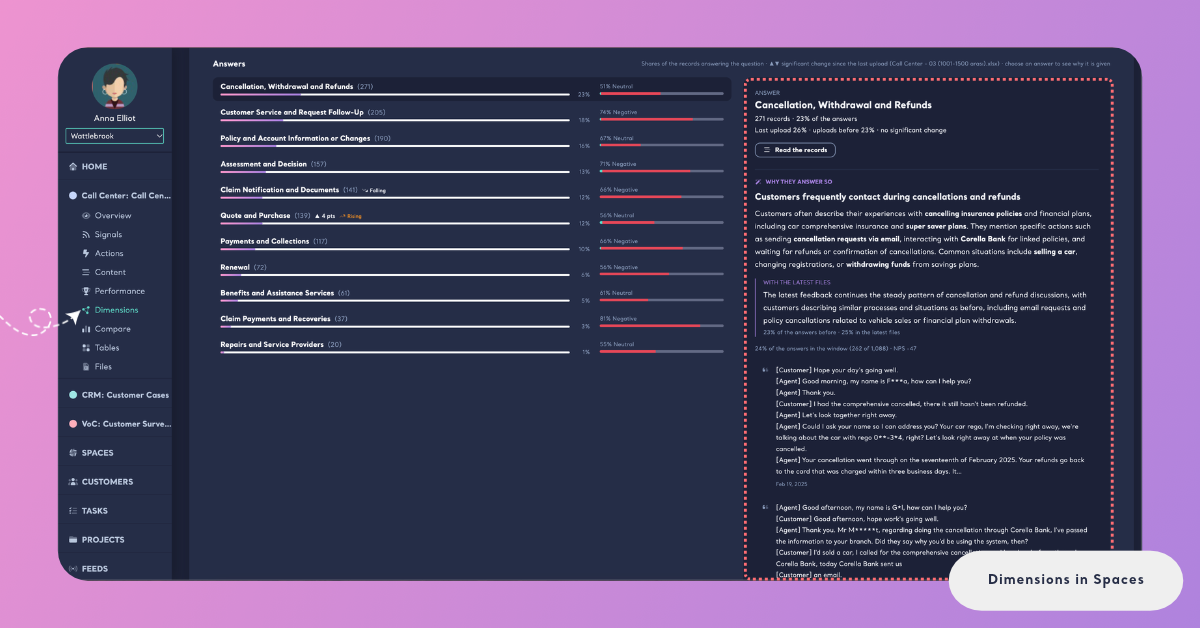
Answers. Every answer with its share, on the left, and the detail of the selected answer on the right: its numbers, Read the records, its Insight Why they answer so, What they talk about and Over time.
Answers no feedback gives. Answers the Dimension model knows that no record has given yet are listed under "No feedback gives these 3 answers yet", so you see which possible answers your customers don't give.
A Space whose Funnel has no Dimension model says "No dimensions in this space", and a Dimension that no feedback answers yet says "No feedback answers this question yet."
The page address keeps the open Dimension, the selected answer and the filters, so a copied link opens the same view for a teammate.
What the Answers Say
What the answers say is the Insight of the open Dimension: a short text Kimola writes over its answers, saying which answers customers give most and what the latest files changed. It is written in the language of the Space's Funnel. It has a bold title, its key terms are in bold, and it carries no numbers: every figure on the page comes from the data next to it.
Under the text, a line tells which records it was written from, for example "Last 47 days · 3,240 records · written 2 hours ago". This is the Insight's window: the latest records of the Space, at least 1,000 records over at least 30 days, or the whole history of a smaller Space ("All history"). Hover over the line to see the exact dates. Read them opens the records the text was written from on Content, filtered to the dates of the window. Earlier texts opens the texts the Dimension had before, each with its date, its window and why it was written again, for example "Written again with its answers" when the texts of its answers changed.
Kimola writes the Insights again after every new file, and only where the evidence moved. While an update runs, the current text stays on the page with a strip such as "Updating the insights with the latest files · 40%". When the update completes, the page says "Updated just now · 5 insights rewritten" and marks every changed text with Rewritten, without a reload. A Space that has classified files and no Insights yet says "The insights of this space are being written for the first time. They will be here when they are ready, without reloading the page." See How Insights Are Updated.
Answers and What Changed Since the Last Upload
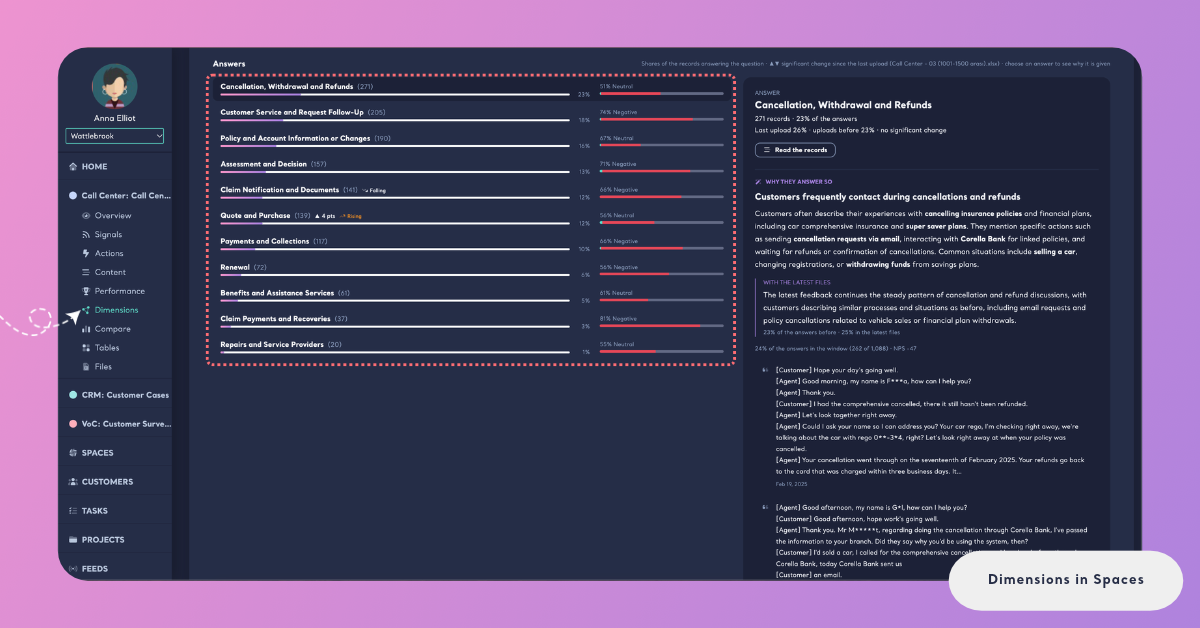
The Answers list shows every answer the Space's feedback gives to the open Dimension, largest first, with the hint "Shares of the records answering the question · choose an answer to see why it is given". Each row shows the answer, its number of records in brackets, its share as a percentage and a bar, and the sentiment most of its records carry with its share, for example "64% Negative". The share is counted among the records that answer the question. One piece of feedback can give more than one answer, so the shares of a Dimension can add up to more than 100%.
When an answer has an Insight that moved, its row also carries the Insight's trend. Hover over it to read what it means:
- New means it was not among the Insights of the updates before.
- Back again means it was among the Insights before, then dropped out, and it is back now.
- Rising and Falling mean its share is significantly higher or lower in the latest files than in the records before them.
- Fading means its share now is significantly lower than it was before.
Since the Last Upload
When the Space has at least two classified files, the page compares the last upload with the uploads before it, and the hint above the list adds "▲▼ significant change since the last upload" with the name of the last file. An answer whose share changed significantly shows ▲ or ▼ with the points it moved, for example "▲ 6 pts". Hover over the badge to see both shares: "Last upload 18%, uploads before 12%: a significant change". An answer without a badge didn't change significantly.
The badge uses the same statistical test as the Insights, so a badge and an answer's text never disagree. Kimola calls a change only when there are enough records on both sides. When too few records of the last upload answer the question, the hint says so instead, for example "only 12 records of the last upload answer it, too few to tell a change", and no answer gets a badge.
The comparison follows the page's filters: with a filter on, it compares the last upload with the uploads before it within the filtered records. When the page is filtered to certain files, there is no last upload to compare, and the badges are not shown.
Why They Answer So
Click an answer in the list to open its detail on the right. The largest answer is selected when you open a Dimension. The detail starts with the answer's name and a line such as "230 records · 20% of the answers". When the page compares the last upload, a second line gives both shares, for example "Last upload 18% · uploads before 12%", and adds "no significant change" when the difference doesn't pass the test.
Why they answer so is the Insight of the answer: why customers give this answer, in a few sentences with a bold title and its key terms in bold. When the answer moved with the latest files, its trend appears next to the caption, and a paragraph under With the latest files says how it moved, with its share before and in the latest files, for example "12% of the answers before · 18% in the latest files". When too few records came before the latest files, it says "Too few records came before the latest files to tell how this answer moved with them." Kimola claims no change without enough records on both sides.
Below the text, the Insight shows the answer's share of the answers in the window and its NPS, for example "18% of the answers in the window (412 of 2,290) · NPS −14", then two or three quotes in customers' own words, each with its date. A quote from the latest files is marked latest files. The window line and Earlier texts close the Insight, as on What the answers say.
An answer gets its own Insight when at least 10 of the Space's latest records give it. Until then, its detail says "No insight yet: an answer gets one when 10 of the latest records give it", followed by the window it was counted in. Its numbers, its themes and its records are still there.
What They Talk About
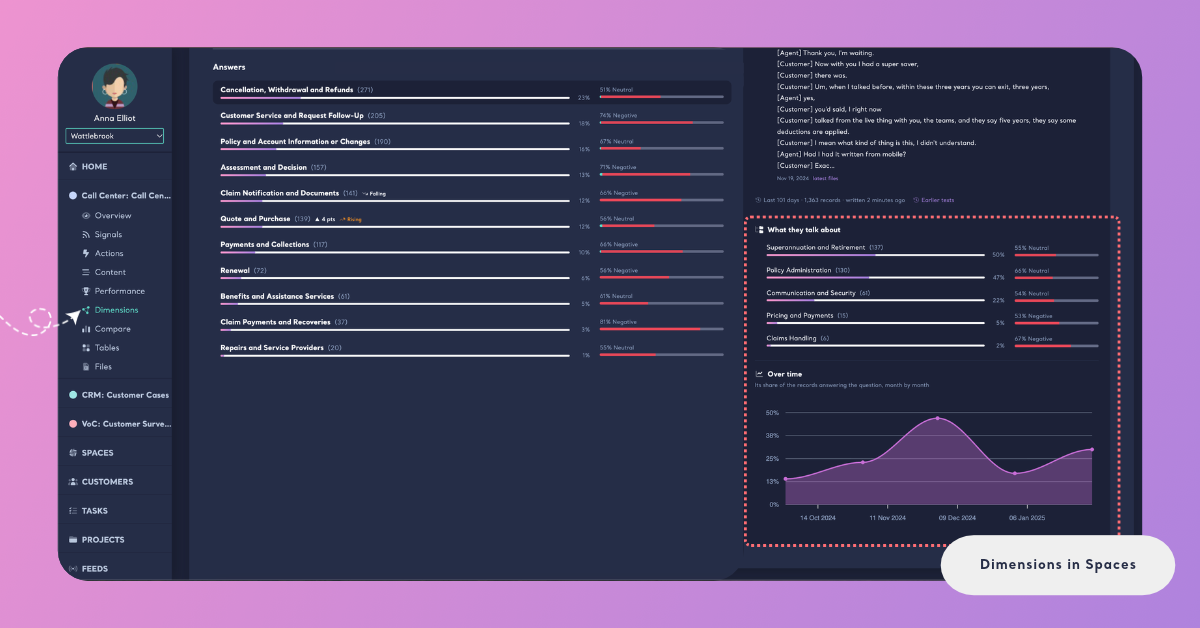
Below the Insight, What they talk about shows what customers talk about when they give the answer: the five largest categories of the Space's content classifier among the answer's records, or its five largest themes when the classifier has no categories. Each row shows its number of records, its share and the sentiment most of its records carry.
This is where a Dimension meets your themes.
For an online fashion retailer, the page tells you whether customers raise a pain point such as Late delivery about orders, returns or customer service.
To cross a Dimension with every theme or a column at once, use Tables in Spaces.
Over Time
Over time shows how the answer's share moved across the period of the page: "Its share of the records answering the question, month by month". For a shorter period, the chart counts by shorter steps. Hover over a point to see its share and the records behind it, for example "18% (41 of 230 answering)".
The chart compares each period with itself: it counts the answer's records among the records that answer the question in that period. A month with fewer records overall doesn't make an answer look smaller. When all the records answering the question fall in one period, the page says "The records answering the question fall in a single period: there is no change over time to show yet."
Filter the Page
The Filters card works as on the other pages of a Space. Pick a label from Classifications, such as a theme or a sentiment, a value from Columns, such as a product or a channel, or an answer from Dimensions, or click the dates to choose a period. Each filter shows as a chip; click the cross on a chip to remove it, or Reset all to remove every filter. See Filter Records in Spaces.
Filters change the page's own numbers: how many records answer the question, the answers and their shares, the comparison with the last upload, What they talk about and Over time. Use them to see how one product line, one channel or one period answers the questions, for example the pain points of negative feedback only.
Filters don't change the Insights. What the answers say and Why they answer so always read the Space's latest records, and with a filter on, the page says so: "The insights read the space's latest records, not the filters above." This keeps a text and the numbers it was written from together.
Open the Feedback Behind an Answer
Every answer leads to the records that give it. Read the records in an answer's detail opens Content filtered to that answer, together with the filters you set on Dimensions, so you read the same feedback the page counted. Read them under What the answers say opens the records within the dates of the Insight's window, the ones its text was written from.
On Content, each record shows its theme, its sentiment and the answers it gives to every Dimension, and you can narrow the records further or make a Task from the filtered view, so a finding goes to the teammate who can act on it.
How It Differs in Reports
A Report has a Dimensions page too. A Report is one dataset analyzed once, so each Dimension gets an AI-written analysis that is written once: a summary, the answers as clusters with their record counts and share of total records, and quotations. A Space keeps receiving files, so in place of that analysis it has Insights written again after every new file, ▲▼ badges for what changed with the last upload and a chart of each answer over time. A Report chooses its Dimensions while it is created; a Space takes them from its Funnel. See Dimensions in Reports.