Content in Spaces
min read - Updated on Nov 09, 2026Content is the page of a Space where you read its records one by one: every row of every classified file, with its text, its column values, its date and the labels Kimola gave it. Above the records, the page shows how many records came in over time, how they spread across the categories of the content classifier and which words customers use most. Every part of the page is also a filter, so Content is where you go from a number to the feedback behind it.
Spaces are available in the Enterprise package and in Kimola On-Premises. To view feedback records on the Content page, sign in to Kimola and open a Space with at least one file that Kimola has finished classifying.
If you don’t have a Space yet, see Create a Space. If you haven’t uploaded your first file, see Add Files to a Space.
You open Content from Content in the menu of an open Space. Many other pages of the Space open it for you, already filtered: the Total Data and NPS cards on Overview, Read them under an Insight, and the links of a Signal.
What You See
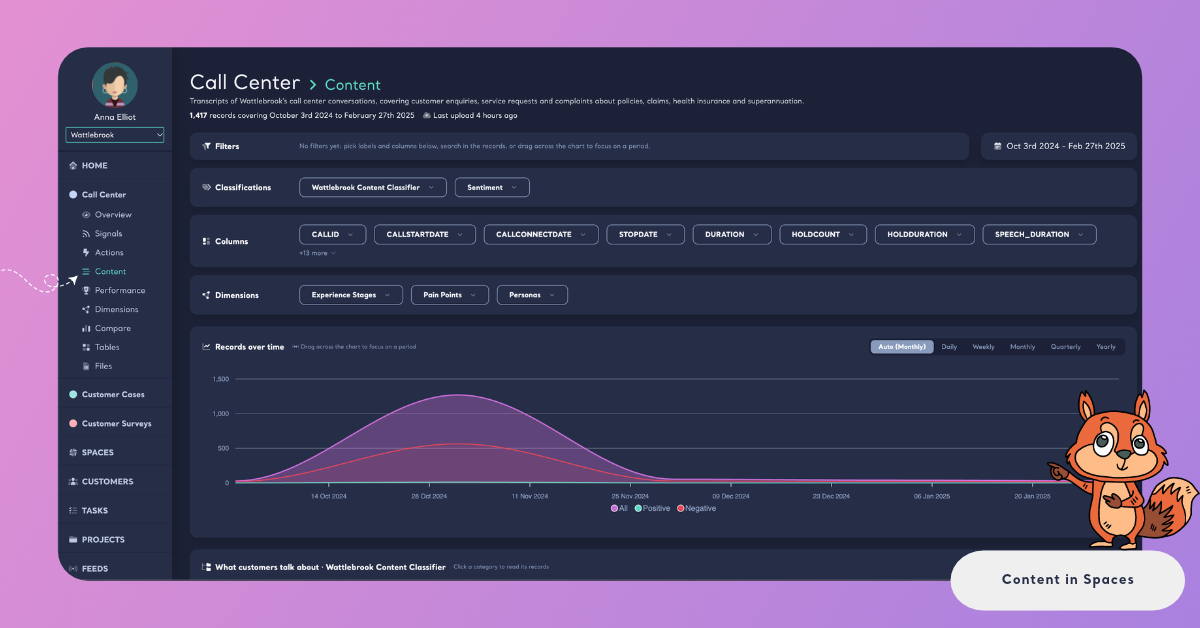
The page opens with the name of the Space and a line that tells what it holds, for example "1,417 records covering October 3rd 2024 to February 27th 2025", with the date and time of the last upload next to it. Only classified records are counted: a file shows on Content once its classification is completed. See Add Files to a Space.
Below that line, the page is read from top to bottom in this order:
- Filters. The filters in use, each as a chip you can remove, and the period of the records on the right.
- Classifications, Columns and Dimensions. One button for each classifier of the Space's Funnel, each column of its files and each Dimension. Pick values from them to filter the records.
- Records over time. A chart of how many records came in, and how many of them were positive and negative.
- What customers talk about. The categories of the content classifier, each with its share of the records.
- Most frequent words. The words that appear most often in the records.
- The records. A search box, the number of records the filters leave, and the records themselves.
Every number on the page follows the filters. When you pick a label, a column value or a period, the chart, the categories, the words and the records all change to show only the records that match.
The Filters Card
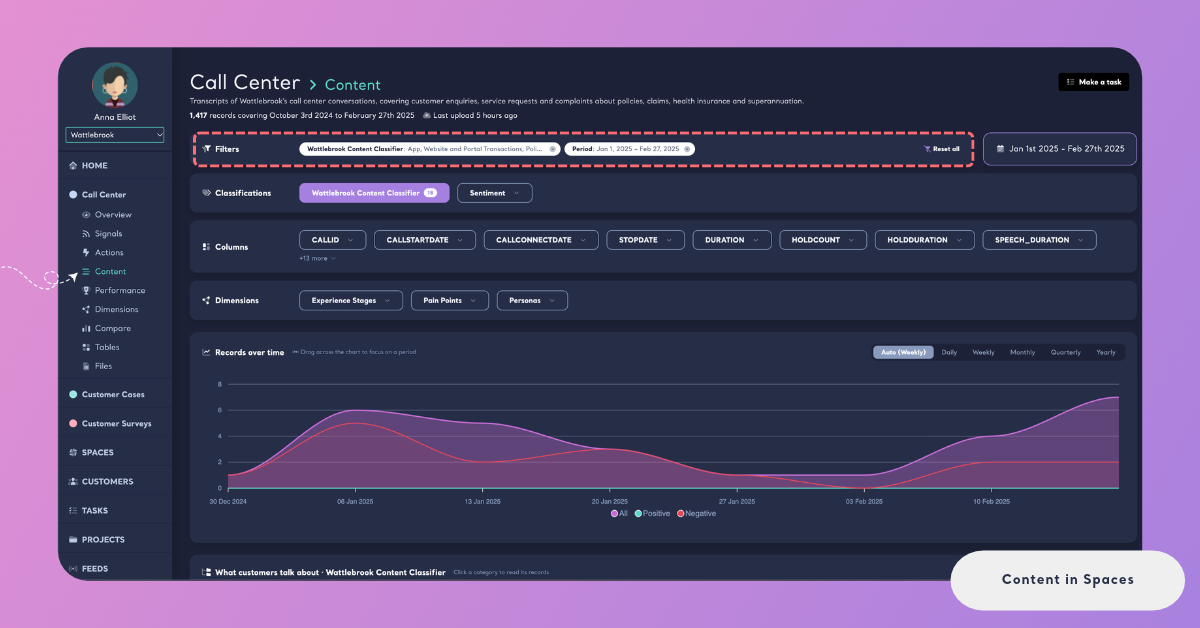
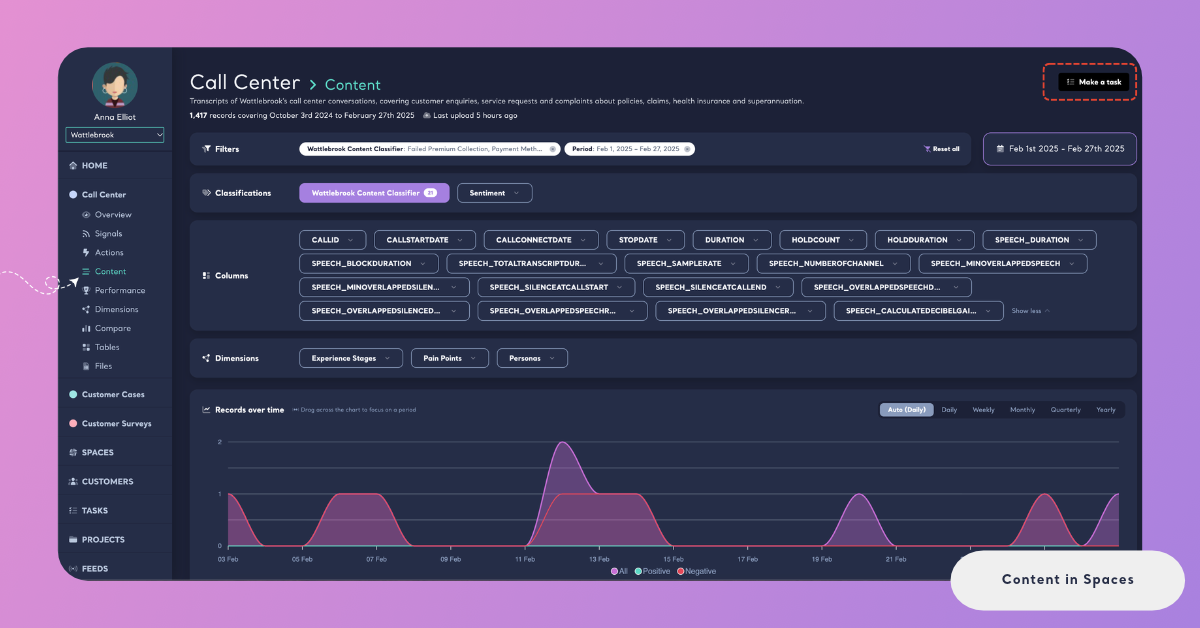
The Filters card lists every filter in use. With none, it says "No filters yet: pick labels and columns below, search in the records, or drag across the chart to focus on a period." Each filter you add shows here as a chip with its name and values. Click the cross on a chip to remove that filter, or Reset all to remove every filter at once.
The period of the records is on the right of the card, for example "Oct 3rd 2024 - Feb 27th 2025". Click it to choose the dates: Space Range covers every record of the Space, and Custom Range lets you pick the first and last day on the calendar. Click Apply to filter the records to those dates.
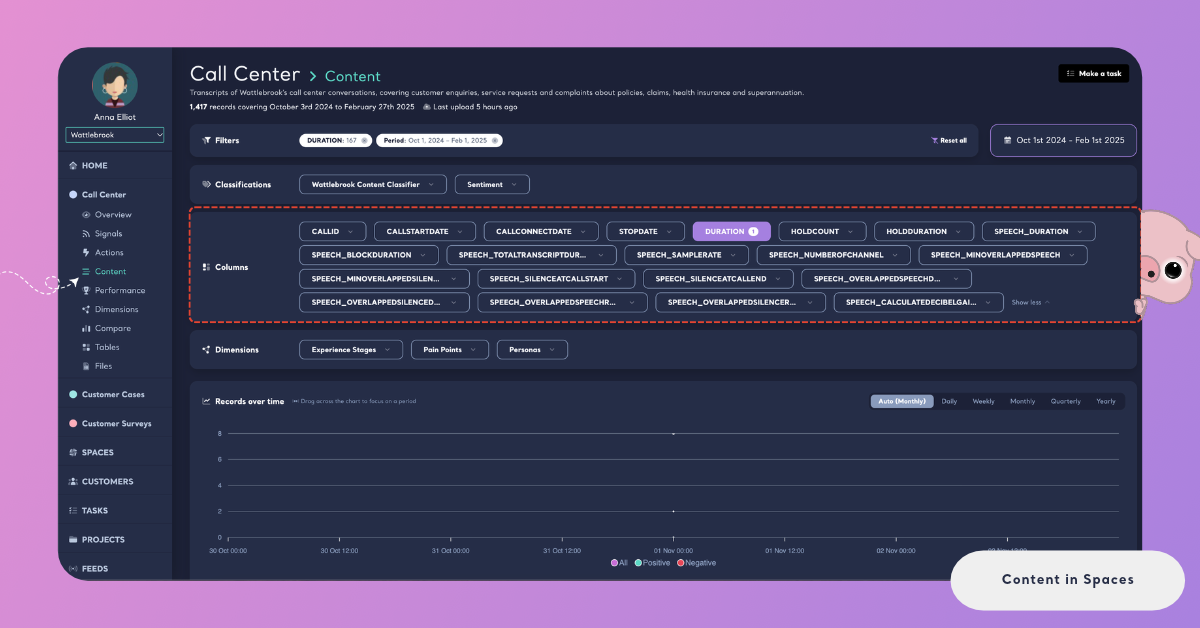
The Classifications card holds a button for each classifier of the Funnel, such as the content classifier and the sentiment classifier. The Columns card holds the columns of the Space's files that are not classified, such as a product name, a channel or a ticket number; when there are many, +5 more shows the rest. The Dimensions card holds the Dimensions of the Funnel, such as Pain Points or Personas. Each button opens a list of its values with a search box ("Search in Pain Points"). When you choose more than one label, the page shows the records labeled with any of them. See Filter Records in Spaces.
The Record List
Below the charts, the search box finds records by the words in their texts: "Search in the records, e.g. claim, refund*". When the texts of the Space are in more than one language, the menu next to the search box (All languages) shows the records of one language only.
An asterisk at the end of a word finds every word that starts with it, so refund* finds refund, refunds and refunded.
Above the records, a line tells how many records you are reading. Without filters it says, for example, "4,245 records in total". With filters it shows the share they leave, for example "1,274 of 3,059 records (41.6%)". The arrow next to the number reloads the records.
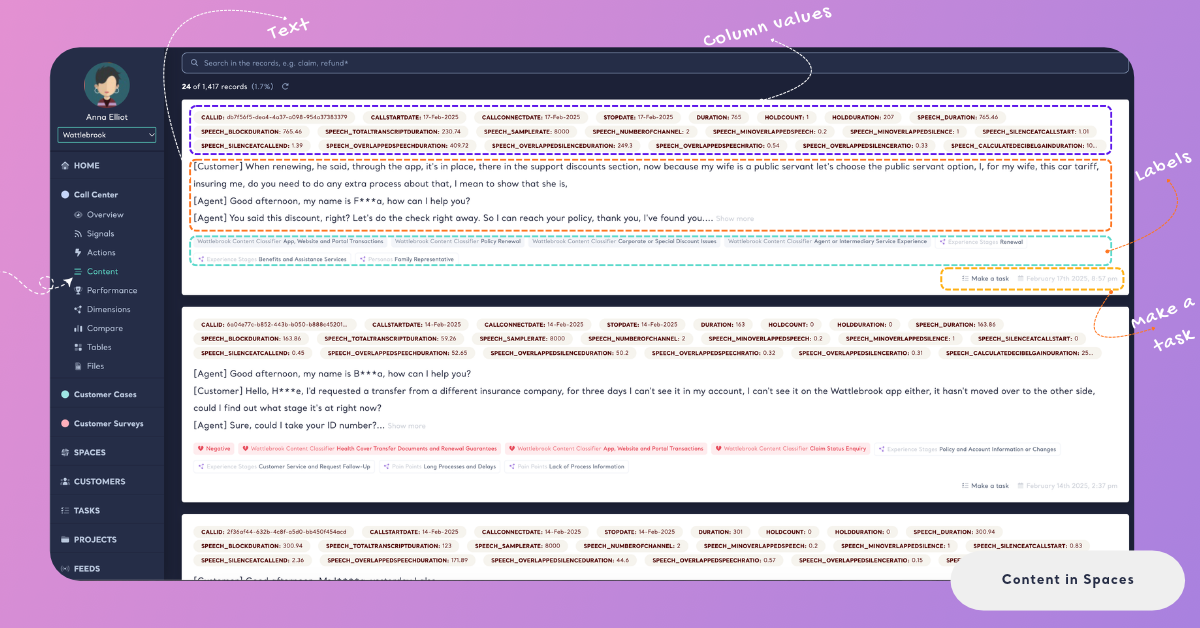
Each record is shown as a card, newest first:
- Column values: The values of the row's other columns, such as a ticket number, a product or a channel, as small chips at the top of the card.
- Text. The feedback itself. A long text, such as a call transcript, is cut short; click Show more to read it whole.
- Labels. The labels Kimola gave the record: the theme from the content classifier, the sentiment (Positive or Negative), and the answers it gives to the Dimensions, each with the name of its model.
- Make a task and the date. The record's date and time come from the Space's Date column.
More records load as you scroll down. If no record matches the filters, the page says "No records match these filters" and asks you to remove a filter or reset them all.
Read by Text Field
A Space can classify more than one text column of the same row. A survey, for example, can have one text field for what customers liked and another for what they would improve. Kimola classifies every text field on its own, so one row can carry a different theme, sentiment and Dimension answer in each of its text fields. You name the text fields when you upload the first file. See Add Files to a Space.
When the Space has more than one text field, you can read the records through one text field or all of them. Choose a text field, and every record shows that field's text with the labels Kimola gave that text; the chart, the categories, the words and the counts follow it too. Choose all of them to read every text field of a row together. A Space with a single text field shows its records directly.
Every row of a file is one record, whatever its number of text fields. A record that gets the same theme in two of its text fields counts once for that theme, so the counts on the page stay counts of rows.
Records Over Time and Frequent Words
The two charts of the page tell you when the feedback came in and what it says, and both can narrow the records with a click.
Records Over Time
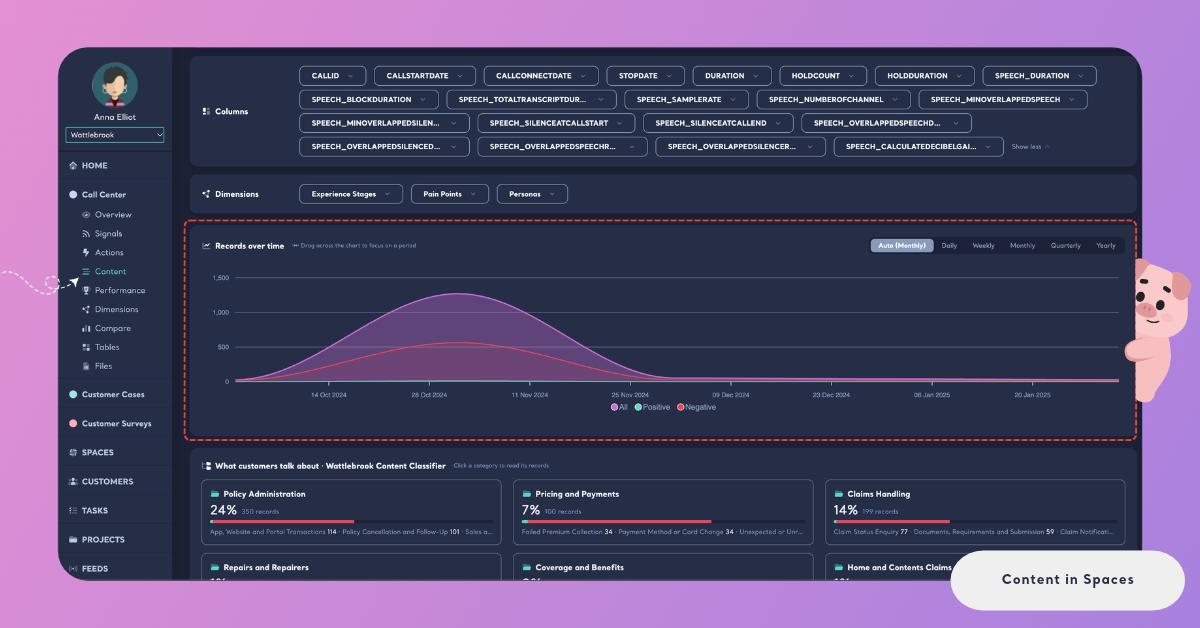
The Records over time chart shows how many records the Space received in each period, as three lines: All, Positive and Negative. Use it to see when the volume rose or fell, and whether a rise came with more negative feedback.
The buttons above the chart set the length of each period: Daily, Weekly, Monthly, Quarterly or Yearly. Auto picks it from the dates you are reading: days for a period under 30 days, weeks under 60 days, months beyond. The button shows its choice, for example Auto (Monthly).
Drag across the chart to focus on a period. The records, the categories and the words change to that period, and the dates show as a filter in the Filters card.
What Customers Talk About
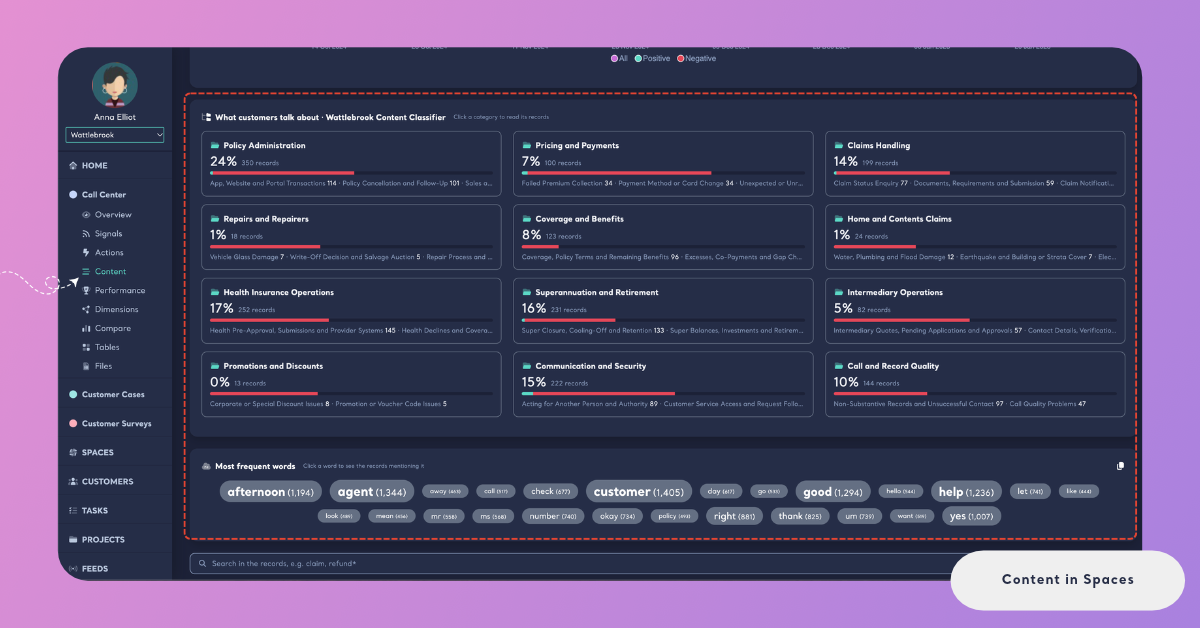
Under the chart, What customers talk about shows the categories of the Space's content classifier, with the classifier's name next to the heading. Each category card shows its share of the records you are reading, its number of records, a bar with its positive and negative share, and its three largest labels with their counts. "Click a category to read its records": a click filters the page to every label of that category, and the cross on the card removes the filter.
These cards count records. The written texts about the themes, the Insights, are on the Space's Overview.
Most Frequent Words
The Most frequent words card shows the words that appear most often in the records, each with its count; the larger a word, the more often it appears. Click a word to see the records mentioning it. The copy button at the top right copies the words with their counts, for use in a document or a spreadsheet.
The words follow the filters too. Filter the records to a negative theme, and the words show what customers say most when they talk about it.
What You Can Do Here
Content is the page where you check what the numbers of a Space are made of, and where you turn what you read into work.
Make a Task of the Feedback
When filters are on, a Make a task button appears at the top right of the page: "Make a task of the feedback these filters show". The task keeps the filters, so its evidence is the same records you are reading. Every record card has its own Make a task too, for a single piece of feedback that needs someone's attention, such as a customer who was promised a call and never got one. Kimola drafts the title and description of the task in the language of the Space's Funnel, and you choose the teammate it is for. See Create a Task.
Open Content from an Insight or a Signal
Other pages of the Space send you here with the filters already set. Read them under an Insight opens the records of its theme or Dimension answer, within the dates of the Insight's window, so you read the same feedback the text was written from. The link of a Signal opens the records of the group it describes. The filters show as chips in the Filters card, and you can change or remove them as usual.
Share a View
The filters of the page are kept in its address. Copy the link from your browser and send it to a teammate: it opens the same view, with the same labels, columns, words and dates. This is how you share a finding with someone who doesn't need a task, such as a manager who wants to read the feedback behind a number.
While the First File Is Classified
A new Space has no records to show until its first file is classified. Until then, Content says "Your first file is being classified" and "Its records appear here as soon as the classification is completed." The records appear when it is done. Later files join the page the same way: a file still being classified isn't counted yet.
How It Differs from Reports
A Report has a Content page too, with the same chart, frequent words and search. A Space's Content works on records that keep coming, so it is built for reading and acting:
- Text fields: A Space can have several text fields, and you read the records through one of them or all; a Report has one text column.
- Tasks: A Space's Content makes tasks from a record or a filtered view. Reports don't make tasks.
- Saved filters and labels: A Report lets you save filters by name, change the label of a record and delete records to Junk. A Space's Content doesn't: its filters live in the page address, so a copied link takes the place of a saved filter, and its records keep the labels the Funnel gave them. To remove a wrong file with all its records, take it back on the Files page. See Take Back a File from a Space.
See Content in Reports for the Report's page.