How NPS Is Calculated in Spaces
min read - Updated on Nov 09, 2026In a Space, NPS is the share of positive feedback minus the share of negative feedback, on a scale from −100 to 100. Kimola calculates it from what customers write: the sentiment classifier of the Space's Funnel labels every record as positive, negative or neither, and the NPS is the difference between the first two shares. A Space where 30% of the feedback is positive and 20% is negative has an NPS of 10. It is not the score of a 0–10 survey question, and it needs a sentiment classifier in the Funnel.
NPS gives every Space, theme, Department and Customer one number for how customers feel, read the same way everywhere, so you can compare them and follow how they change file by file.
NPS in Spaces is available in the Enterprise package and in Kimola On-Premises. To see NPS, sign in to Kimola and open a Space whose Funnel includes a sentiment classifier and that has at least one classified file.
If you’re setting up your first Space, see Create a Space. For help setting up the classifier or uploading your first file, see Create a Funnel and Add Files to a Space.
What NPS Means in a Space
A Space collects the feedback of one channel, such as call center conversations, social media or a survey, and classifies every record with the same Funnel. NPS is the metric that tells, in one number, whether that feedback leans positive or negative.
A positive NPS means customers write positively more often than negatively. A negative NPS means the opposite. 100 means every record is positive, −100 that every record is negative, and 0 that positive and negative feedback are equally common. Feedback that is neither positive nor negative, such as a question or a plain request, counts in the total but in neither share, so a channel full of neutral conversations has an NPS close to 0 even when the few emotional ones are mostly negative.
Every Space has its own NPS, and so does every theme and category in it. Because all of them come from the same rule and the same Funnel, you can put the NPS of your call center next to that of your social media, or the NPS of one theme next to another, and compare them.
How It Is Calculated
The formula is the same everywhere in Spaces: NPS = the share of positive feedback − the share of negative feedback. What changes is which records the shares are taken from and which sentiment is counted, the one of the whole record or the one about a theme.
The NPS of a Space
The NPS of a Space reads all its classified records. The Funnel's sentiment classifier gives every record one sentiment, Positive, Negative or none, and Kimola counts the share of each in the Space.
A hotel chain's review Space has 2,000 records. The sentiment classifier labels 600 of them positive, 400 negative, and 1,000 neither. The shares are 30% positive and 20% negative, so the Space's NPS is 30 − 20 = 10.
Each share is a whole percentage, rounded down, before the subtraction. An NPS you calculate yourself from the exact counts can therefore differ from the one on screen by a point.
The NPS of Home, of a Department and of a Customer follows the same rule on their own records: all your Spaces together for Home, the feedback a Department owns, and every record a Customer wrote in any Space.
The NPS of a Theme or a Category
The NPS of a theme reads only the records of that theme. Its sentiment is the one the record expresses about that theme, so a single record can be positive about one theme and negative about another. A customer who thanks the agent but complains that their claim is still open counts as positive for the agent's theme and negative for the claim's theme, whatever the sentiment of the whole conversation is.
A theme has 200 records. In 30 of them customers speak about it positively, in 110 negatively, and in 60 neither. The shares are 15% positive and 55% negative, so the theme's NPS is 15 − 55 = −40.
A category's NPS is calculated the same way from the records of all its labels, each record counted once.
Because a theme's NPS reads how customers talk about that theme, it tells you more about the theme than the overall sentiment of the records that mention it.
When There Is No NPS
NPS needs a sentiment classifier. A Space whose Funnel has no sentiment classifier has no NPS, and a Department of such a Funnel says "No NPS: it needs a sentiment classifier in the funnel". To get NPS, add a sentiment classifier to the Funnel. See What is a Funnel?.
When NPS Changes
The NPS of a Space is calculated again every time a file finishes its classification. A file still being classified doesn't count yet. When you take a file back, the NPS is recalculated without its records. See Add Files to a Space and Take Back a File from a Space.
Since every file adds to the records before it, the NPS of a large Space moves slowly.
Where You See It
NPS appears wherever Spaces are summarized, always on the same scale from −100 to 100.
- Spaces list: Every Space shows its NPS in a ring next to its name.
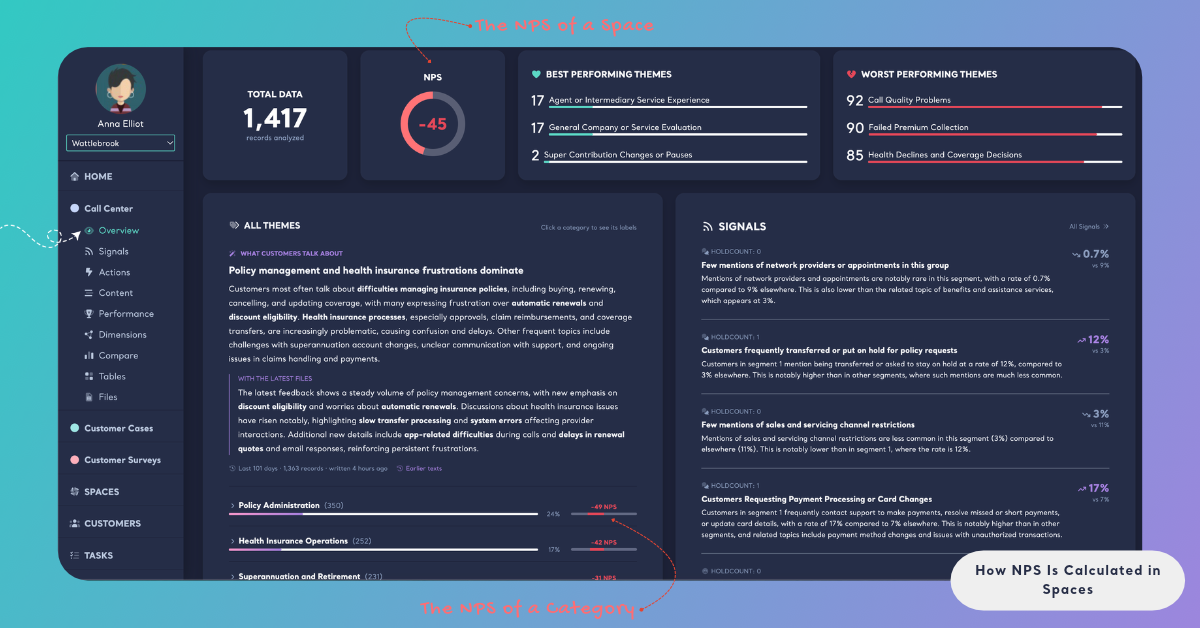
- Overview: The NPS card shows the Space's NPS as a ring. The ring fills green clockwise from the top when the NPS is positive and red counterclockwise when it is negative, so you can read the direction before the number. Hover over it to see how the number is made, for example "NPS -8: 7% Positive − 15% Negative". See Overview in Spaces.
- Themes and categories: In All Themes on the Overview, every category and label row shows its NPS with a two-sided bar, green for positive and red for negative. Hover over a category to see the shares behind it, for example "NPS -17 (2% Positive − 19% Negative)".
- Home: Once your account has Spaces, Home shows the NPS of all your Spaces together, the NPS of each Space in the Spaces card and, when your account has Departments, the NPS of each Department.
- Departments and Customers: Every Department and every Customer has its own NPS, on the list and on its page. You can sort Customers by Lowest NPS to find the customers who write most negatively. See What is a Department? and What is a Customer?.
- Insights: The evidence of a Dimension answer's Insight shows the answer's NPS next to its share, for example "12% of the answers in the window (380 of 3,240) · NPS -21". See What is an Insight?.
- Tasks: A Task keeps the NPS of its finding as evidence when it is made. After the task is done, Kimola checks whether the finding's NPS rose clearly as one of the signs that customers noticed. See What is a Task?.
A Report has no NPS card, but Compare in Reports shows the sentiment shares and the NPS of every group it compares.
Small Numbers
NPS is a difference between two shares, so it can swing widely when there are few records. A customer with one positive record has an NPS of 100, and a theme with three records, all negative, has an NPS of −100. Both numbers are correct, but neither says much yet.
Before you act on an NPS, check how many records it reads. The number of records is shown next to every Space, category, theme, Department and Customer. For ranking themes against each other, use the Satisfaction and Dissatisfaction Scores, which take the number of records into account.
NPS and Satisfaction Scores
Kimola also scores themes with a Satisfaction Score and a Dissatisfaction Score. These are not NPS, and the two answer different questions.
NPS tells how positive or negative the feedback about something is. It is the same whether 10 or 10,000 records say it. The Satisfaction Score is a theme's share of positive feedback and the Dissatisfaction Score its share of negative feedback, "statistically adjusted to ensure fair comparison across different cluster sizes". They rank themes by their size and their share together, so a theme that many customers praise or complain about ranks above a small theme with the same share.
A theme with 3 records, all negative, has an NPS of −100. A theme with 400 records, 300 of them negative and none positive, has an NPS of −75. By NPS, the first looks worse. Its Dissatisfaction Score, however, is lower, because three records are not enough evidence, while the second theme is a problem for hundreds of customers.
That is why the Best Performing Themes and Worst Performing Themes cards on the Overview and the Performance page rank themes by Satisfaction and Dissatisfaction Scores, not by NPS. Use NPS to read how customers feel about a Space, a theme or a team's feedback, and the scores to decide which themes matter most.
NPS and Survey NPS Scores
The NPS you know from surveys comes from a single question: "How likely are you to recommend us to a friend or colleague?", answered from 0 to 10. Promoters answer 9 or 10, detractors 0 to 6, and the survey's NPS is the percentage of promoters minus the percentage of detractors.
Kimola's NPS in Spaces is calculated from the text of the feedback, not from a score. It uses the same idea, positive minus negative, and the same scale from −100 to 100, but it doesn't ask customers anything. That is why it works for any channel: call center conversations, social media posts, reviews and open-ended survey answers, where no one gave a score.
The two numbers measure different things, so they can differ for the same customers. A customer can give a 9 and still complain about one thing in their comment, and a call center conversation has no score at all.
If your survey file has a score column, upload it to a Space with the rest of the file. Kimola doesn't classify that column, but you can use it to filter and compare the feedback. With Compare in Spaces you can put the comments of different scores side by side and see what promoters and detractors write about. See How to Analyze NPS Survey Comments for the whole method.