Overview in Spaces
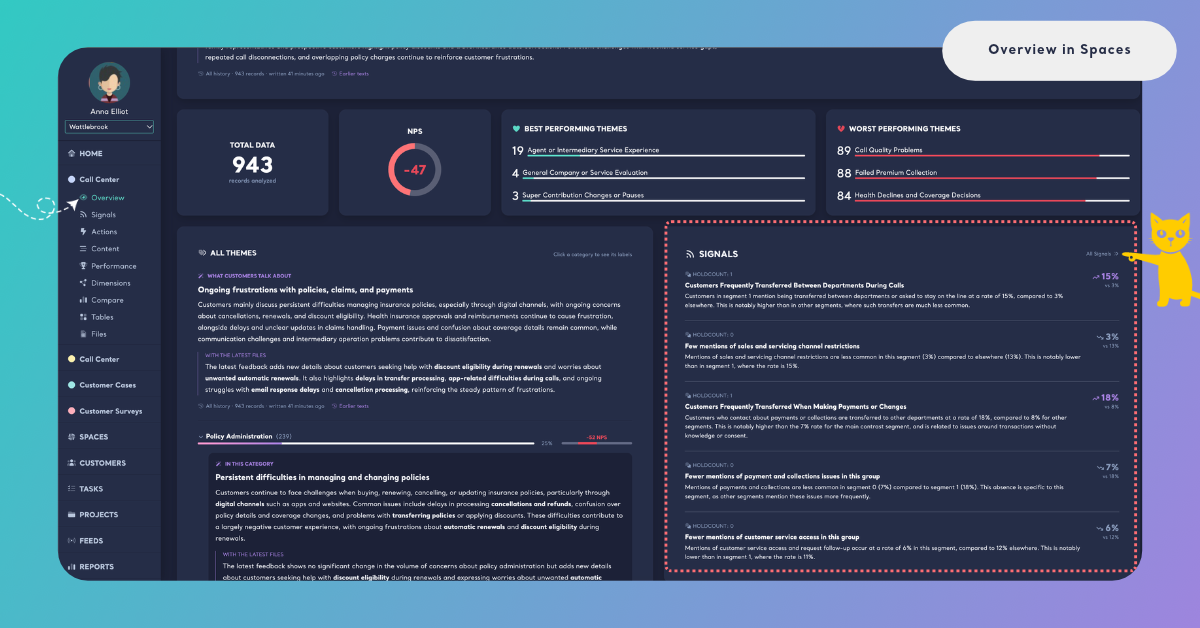
min read - Updated on Nov 06, 2026Overview is the first page of every Space: it shows on one screen what the Space's feedback says now, what changed with the latest files, how many records the Space holds, its NPS, its best and worst performing themes, every theme by category, its strongest Signals and its Dimensions. Most cards open the page that goes deeper into them, so Overview is where you start reading a Space and decide where to look next. Once your account has Spaces, Home shows the same kind of summary for all of them together.
You open Overview by clicking a Space's name in the main menu, under Home, or Overview in the menu of an open Space.
Sign in to a Kimola account with the Enterprise package or to your organization’s Kimola On-Premises installation. To see analysis results on Overview, you need a Space with at least one file that Kimola has finished classifying.
If you don’t have a Space yet, see Create a Space. If your Space is empty, see Add Files to a Space.
What You See
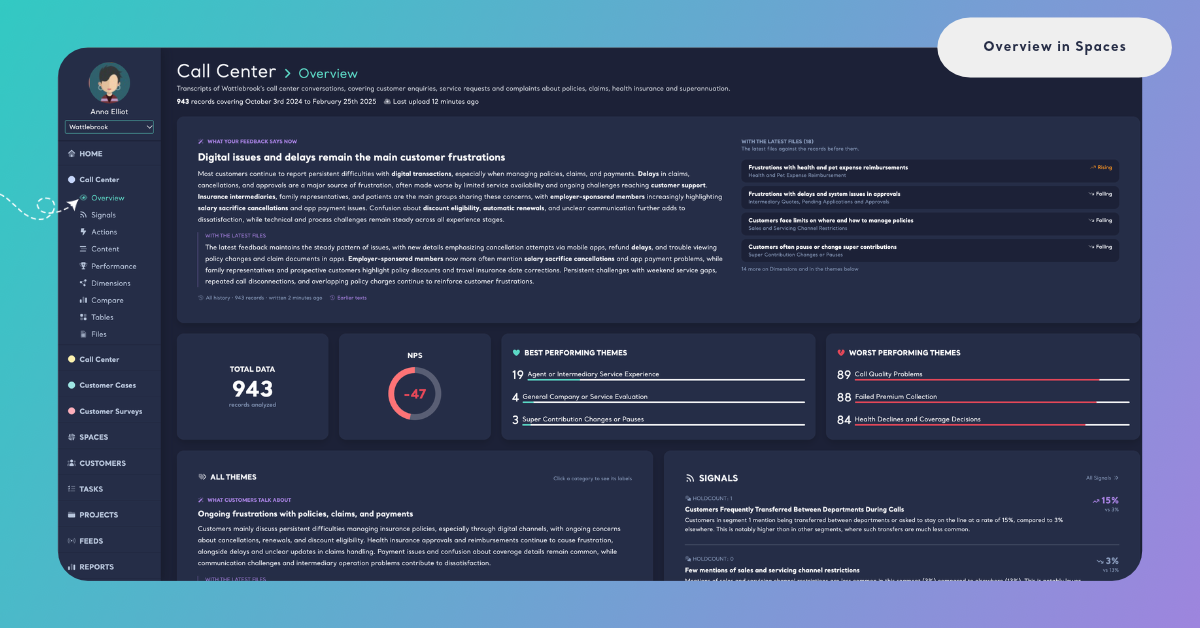
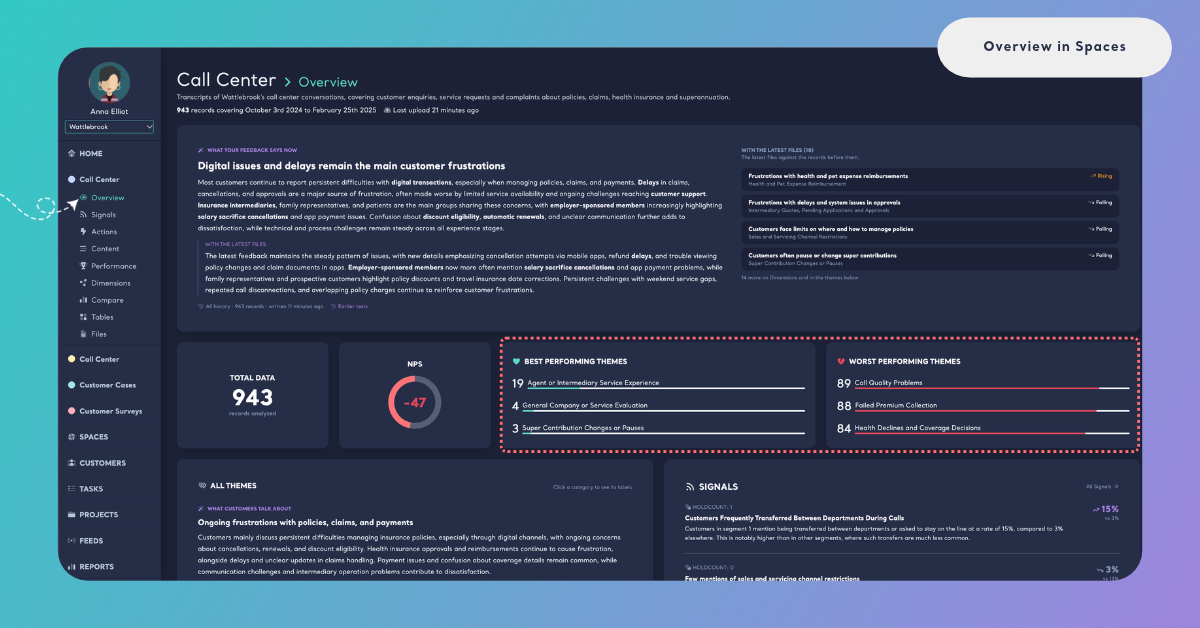
The page opens with the name of the Space and a line that tells what it holds, for example "943 records covering October 3rd 2024 to February 25th 2025", with the date and time of the last upload next to it. The records are the classified ones: a file counts on Overview only once its classification is completed. See Add Files to a Space.
Below that line, the page is read from top to bottom in this order.
- What your feedback says now: The Space's Insight, with the answers and themes that moved with the latest files and the ones fading lately.
- Total Data and NPS: How many records the Space has analyzed, and its NPS as a ring.
- Best Performing Themes and Worst Performing Themes: The three themes customers are most satisfied with and the three they are most dissatisfied with.
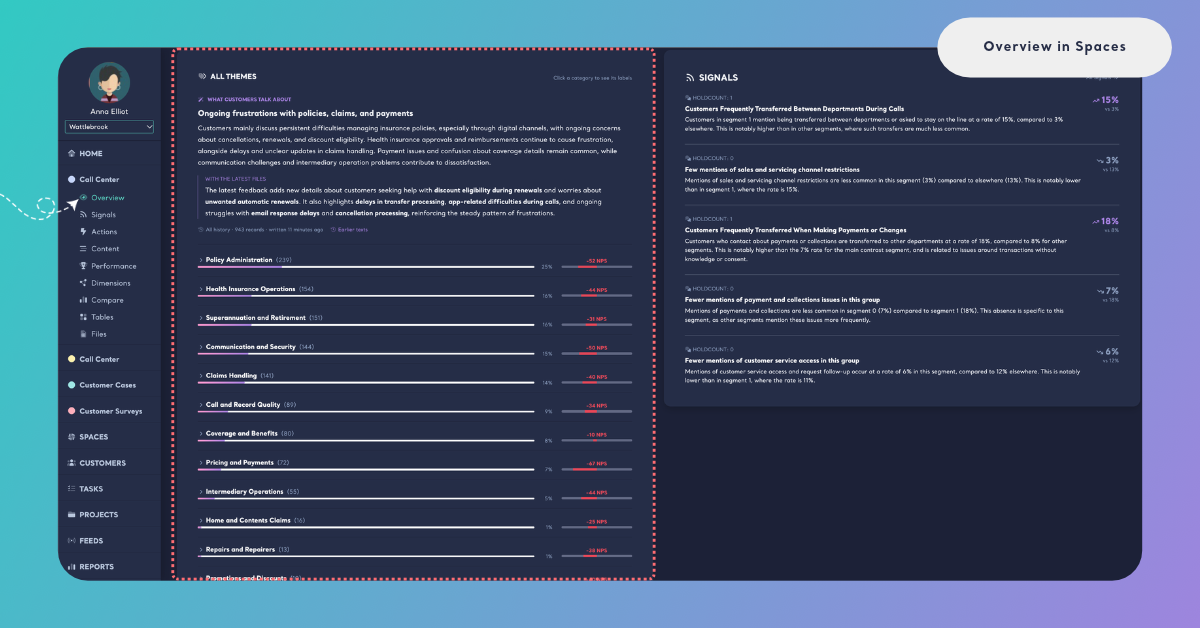
- All Themes: Every category of the Space's content classifier with its labels, its share of the feedback and its NPS, and the Insights written about them.
- Signals: The Space's strongest statistically tested findings, when it has Signals.
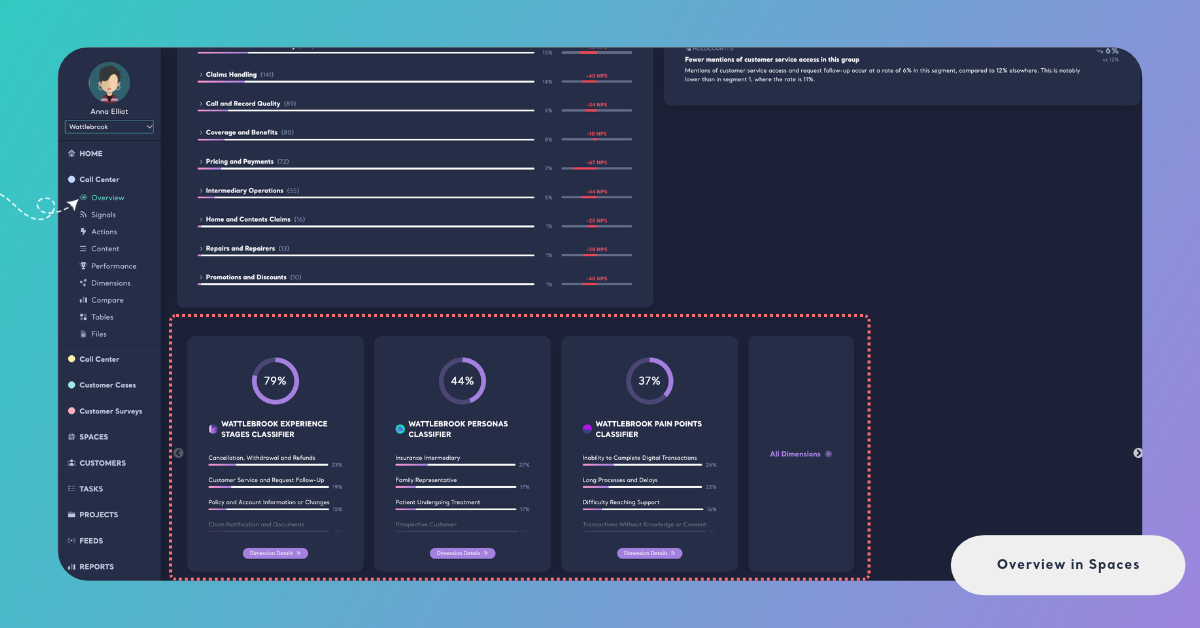
- Dimensions: One card for every Dimension of the Space's Funnel, with its most frequent answers.
Every number on the page reads all the classified records of the Space. The only exception is the Insights: their numbers come from the latest records they were written from, and every text says which ones.
A Report has an Overview too, with its own cards. See Overview in Reports.
What Your Feedback Says Now
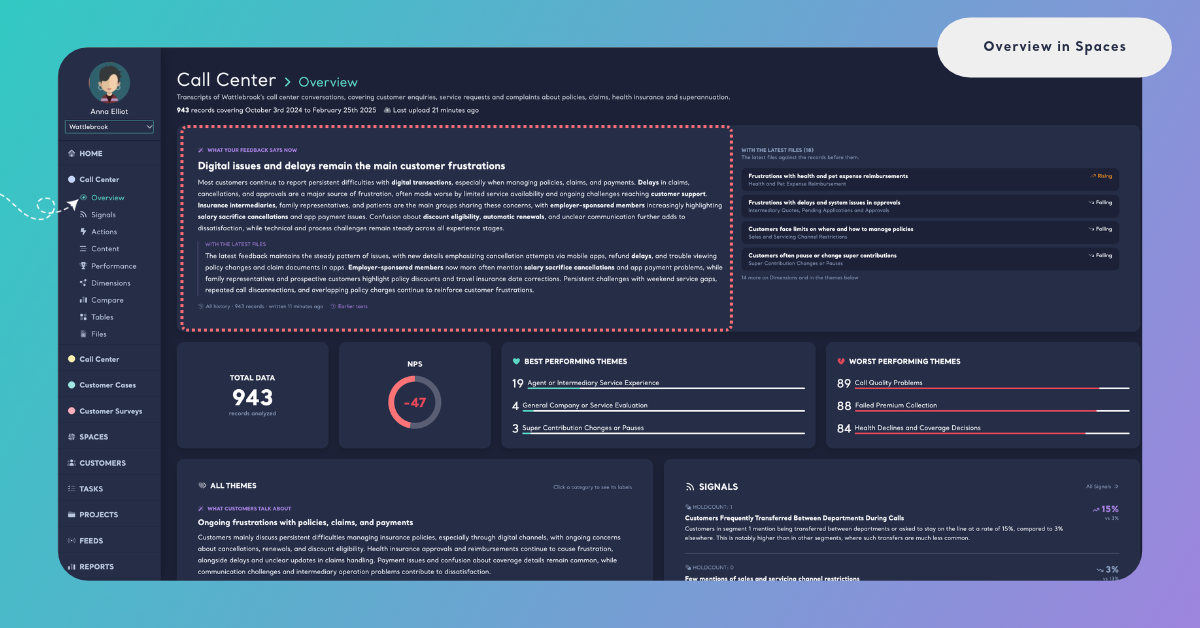
The top of the page holds What your feedback says now: a short text Kimola writes about the whole Space after every new file. It says what customers talk about now and what the latest files changed, in the language of the Space's Funnel. It has a title, and its key terms are in bold. Kimola decides with fixed rules what the text is about and which records it reads; an AI model only writes the words. The text itself carries no numbers, so every figure you see next to it comes from the data.
Under the text, a line tells which records it was written from, for example "Last 47 days · 3,240 records · written 2 hours ago". This is the Insight's window: the latest records of the Space, at least 1,000 records over at least 30 days, or the whole history of a smaller Space ("All history"). Hover over the line to see the exact dates. Earlier texts opens the texts the Space had before, each with its date, its window and why it was written again. See How Insights Are Updated.
With the Latest Files and Fading Lately
Next to the text, the page lists what moved, in two groups that are compared in different ways.
With the latest files ("The latest files against the records before them.") lists the themes and Dimension answers whose share changed significantly in the newest files compared with the records before them. Each item shows the title of its Insight, its trend and the theme or answer it is about. The trend is New (it was not among the Insights before), Back again (it was among them before, then not, and it is back now), Rising or Falling (its share is significantly higher or lower in the latest files than in the records before them).
Fading lately lists what customers mention significantly less often now than before, for example "Significantly less often in the last 102 days than before them." Its items carry the trend Fading.
Each group shows at most four items, with its total count in the heading, such as With The Latest Files (12). When there are more, a line such as "8 more on Dimensions and in the themes below" tells where to find the rest. Click an item to go to it: a theme opens in All Themes further down the same page and scrolls to its place, and a Dimension answer opens on the Dimensions page.
While the Insights Are Being Written
The texts follow the files of the Space, so the top of the page can also show their progress. A Space that has classified files but no Insights yet says "The insights of this space are being written for the first time. They will be here when they are ready, without reloading the page."
When a new file has been classified, the current texts stay on the page while the new ones are written, with a strip such as "Updating the insights with the latest files · 40%". When the update completes, the strip says "Updated just now · 5 insights rewritten", and every text that changed carries a Rewritten mark, without a reload. A text that the latest update did not write again says "not rewritten with the latest files" in its window line.
Total Data and NPS
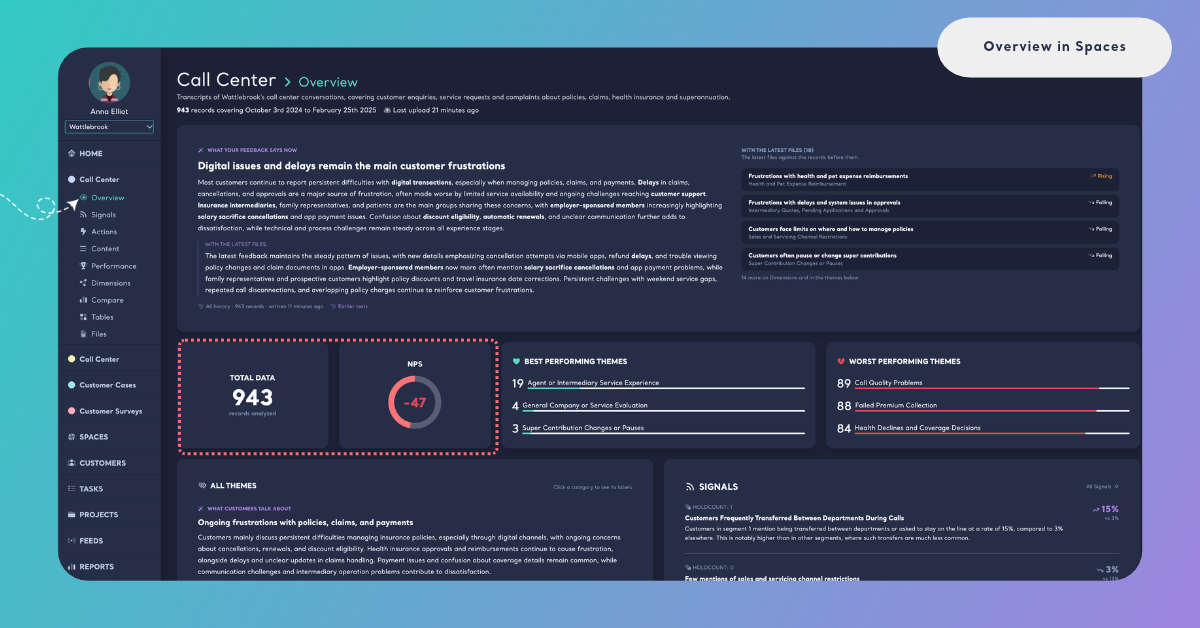
The Total Data card shows how many records the Space has analyzed, as "records analyzed". Every record is one row of an uploaded file, classified in all of the Space's text fields. Click the card to read the records on Content.
The NPS card shows the Space's NPS as a ring, on a scale from −100 to 100. In a Space, NPS is the share of positive feedback minus the share of negative feedback, as the Funnel's sentiment classifier labels it. The ring fills green clockwise from the top when the NPS is positive and red counterclockwise when it is negative, so you can tell the direction before reading the number. Hover over the ring to see how the number is made, for example "NPS -8: 7% Positive − 15% Negative". Click the card to read the records on Content.
This NPS is calculated from what customers write. It is not the score of a 0–10 survey question, and it needs a sentiment classifier in the Space's Funnel. See How NPS Is Calculated in Spaces.
Best and Worst Performing Themes
The Best Performing Themes card lists the three themes with the highest Satisfaction Score, each with its score and a green bar. The Worst Performing Themes card lists the three with the highest Dissatisfaction Score, each with a red bar. Hover over a theme to see its name and score in full.
These cards don't rank themes by NPS. A Satisfaction Score is a theme's share of positive feedback and a Dissatisfaction Score its share of negative feedback, statistically adjusted so that a small theme and a large one compare fairly. A theme mentioned by a handful of customers, all of them angry, doesn't outrank a theme that hundreds of customers complain about. Click either card to see the scores of every theme on Performance.
A new Space may not have scores to show yet. In that case the cards say "No theme has positive feedback yet." or "No theme has negative feedback yet."
All Themes by Category
The All Themes card shows everything the Space's content classifier found, grouped by category: "Click a category to see its labels". Every category row shows its name, its number of records, its share of the feedback and its NPS with a two-sided bar. Hover over a category to read its description and its NPS with the shares behind it, for example "NPS -17 (2% Positive − 19% Negative)".
At the top of the card, What customers talk about is the Insight of the content classifier: a text about the themes customers mention most and how they moved, with its window line and Earlier texts. It follows the same rules as the Space's own text.
Open a Category
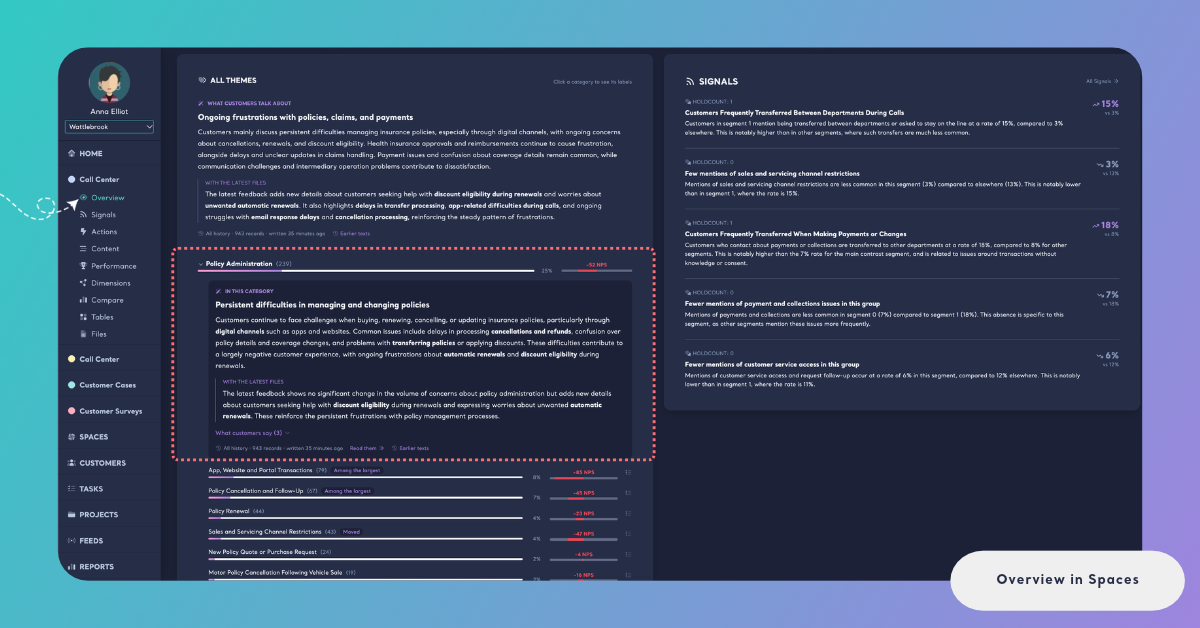
Click a category to open it. Its Insight, In this category, appears first: a text about what customers say in that category, with What customers say (2–3 quotes from the feedback, the ones from the latest files marked "latest files"), its window line, Read them and Earlier texts. Read them opens the category's records on Content, filtered to the dates of the window.
Below the text, the category's labels are listed with their number of records, their share and their NPS. A label row can carry chips that say why Kimola wrote an Insight about it: Among the largest, Moved, Most dissatisfied, Open task, Followed or Summarized on demand. Hover over a chip to see what it means. A star on the row means that someone in your team follows the theme.
Open a Theme
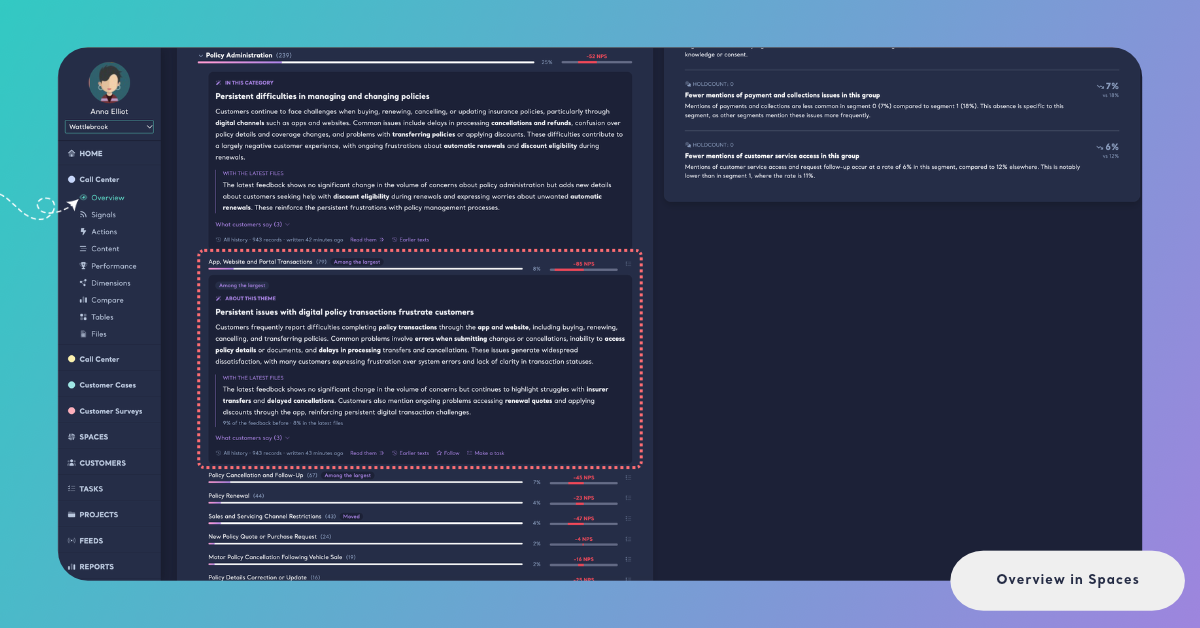
Click a label to open it. When the label has an Insight, About this theme shows its title and text, What customers say with its quotes, the window line, Read them and Earlier texts. When the theme moved with the latest files, its text also says how, with its share before and after, for example "3% of the feedback before · 6% in the latest files". If too few records came before the latest files to tell, the text says so instead of claiming a change.
Kimola writes Insights for the largest themes, the ones that moved, the most dissatisfied, the ones with an open task and the ones your team follows. Any other theme says "No insight for this theme in the latest update." and offers Summarize this, which writes its text in a few seconds from the records of the latest update.
Every theme offers two more actions. Follow makes every update of the Insights write the theme, for the whole team; click Following to stop. Make a task turns the theme into a Task for a teammate, with its numbers and quotes kept as evidence. See Follow and Summarize Themes and Create a Task.
Signals
The Signals card shows the Space's strongest Signals: statistically tested findings about where the feedback differs between groups or changes over time. Each Signal names the group it is about, such as an answer of a Dimension, followed by its title, a short explanation and its number next to the number it is compared with, for example "6%" against "vs 1.8%". An arrow shows whether the finding is higher or lower in that group.
The Signals of a Space run again after every classified file, so this card changes as the Space grows. Click a Signal or All Signals to read every Signal with its evidence and give your verdict on Signals. The card appears once the Space has Signals, as does Signals in the Space's menu.
A Signal and an Insight are different things. A Signal is a tested comparison between groups or periods; an Insight is a written reading of the Space's latest feedback.
Dimensions
The last part of the page shows the Space's Dimensions, one card each, in a row you move through with the arrows on its sides. A Dimension is a research question Kimola asks of every piece of feedback, such as Pain Points ("What goes wrong or creates difficulty?") or Personas ("Who is experiencing this?").
Each card shows a ring with the share of the Space's records that answer the Dimension, its name and its most frequent answers with their shares. Hover over the name to see the Dimension's question, and over an answer to see how many records give it. Dimension Details opens the Dimension on the Dimensions page, where you also find its Insight, What the answers say. A Dimension that no feedback answers yet says "No feedback answers it yet." The last card, All Dimensions, opens the Dimensions page.
Home: All Your Spaces Together
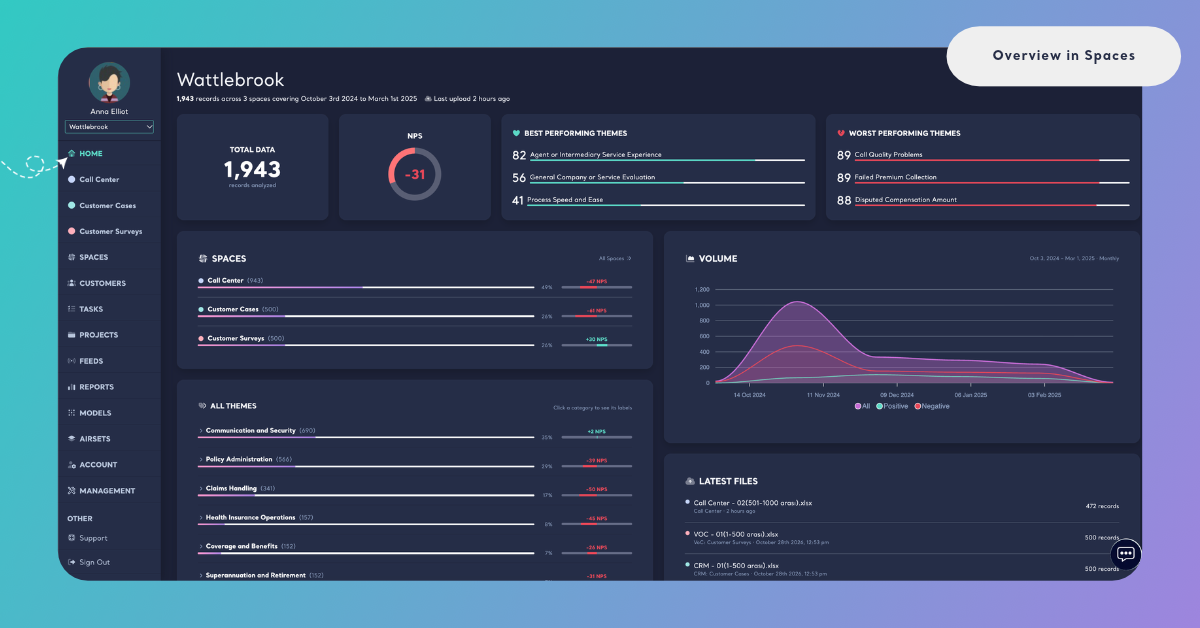
Once your account has Spaces, Home reads all of them as one. It is the first page you see after signing in, and HOME in the main menu opens it. The page starts with the name of your account and a line such as "1,943 records across 3 spaces covering October 3rd 2024 to March 1st 2025", with the time of the last upload.
- Total Data, NPS, Best Performing Themes and Worst Performing Themes. The same cards as on a Space's Overview, counted over the records of every Space.
- Spaces. Every Space with its number of records, its share of all your feedback and its NPS. Click a Space to open its Overview, or All Spaces to open the list of Spaces.
- Departments. Shown only when your account has Departments: "Each team's share of its product's feedback, and its NPS". Departments are grouped by product, and each one shows its number of records, its share of its product's feedback and its NPS. Click a Department to open its page, or All Departments for the list. Departments are set up by the Kimola team together with you; to add one, talk to your Account Manager.
- All Themes. The categories and labels of the content classifier, with their records, shares and NPS, across all your Spaces. Insights are written for each Space, so this card has none; open a Space's Overview to read them.
- Volume. How many records came in over time, across the whole period of your Spaces. Switch between All, Positive and Negative to see how the volume of each sentiment moved.
- Latest Files: The newest files of every Space, files still being classified first, each with the Space it belongs to, the time of its upload and its number of records. A file still being classified shows "New data is being analyzed". Click a Space's name on a file to open that Space's Files page.
Home reads every Space as if they shared one Funnel, so its themes and NPS are clearest when your Spaces use the same Funnel. A Space classified with a different Funnel is best read on its own Overview.